Solar Resource Assessment for Power Projects: A Technical Guide
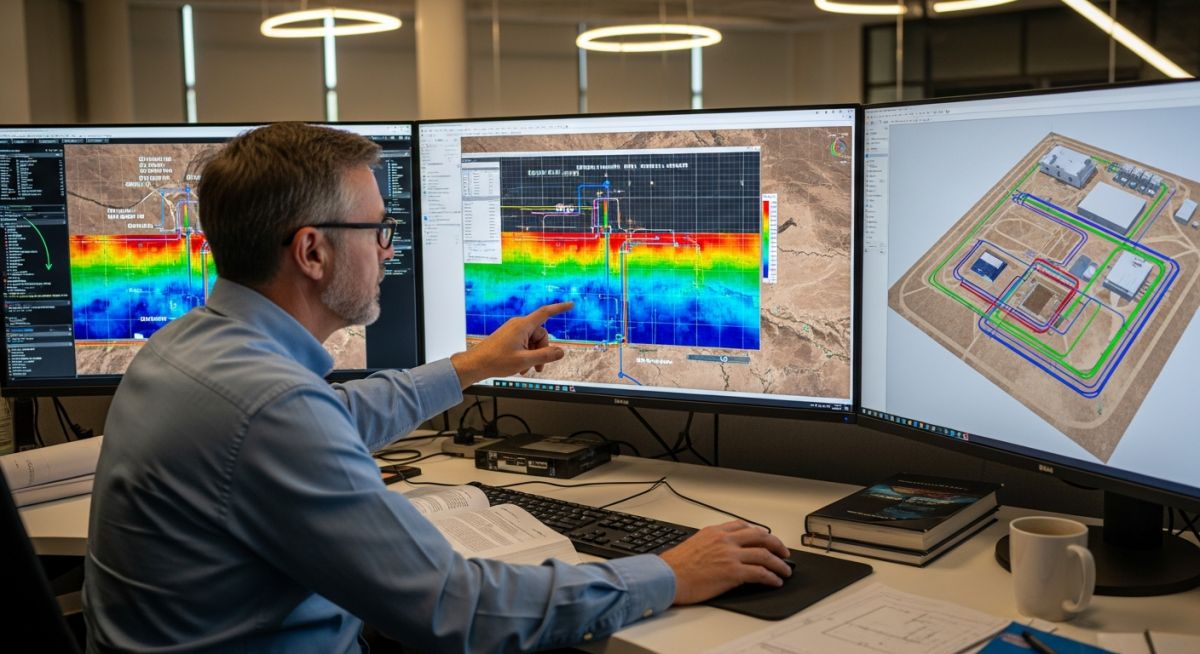
In my two decades of experience across energy infrastructure, I have learned that the financial viability of any solar project rests entirely on the accuracy of the initial resource assessment. It is not merely about placing panels in a sunny field; it is about understanding the complex interplay of atmospheric conditions, site-specific shading, and long-term meteorological trends.
Engineers must move beyond simple averages. We must account for the variance in solar irradiance components—DNI, GHI, and DHI—to ensure that our P50 and P90 yield estimates hold up under the scrutiny of project financiers. This guide breaks down the technical rigor required to move from raw site data to a bankable energy model.
Key Takeaways for Project Success:
- Prioritize high-quality ground-based measurement over satellite-only data for bankability.
- Understand the distinct roles of DNI for CSP and GHI for PV technologies.
- Implement rigorous uncertainty analysis to satisfy lender requirements for P90 confidence levels.
- Account for inter-annual variability using at least 10-20 years of historical meteorological data.
Complete Course on
Piping Engineering
Check Now
Key Features
- 125+ Hours Content
- 500+ Recorded Lectures
- 20+ Years Exp.
- Lifetime Access
Coverage
- Codes & Standards
- Layouts & Design
- Material Eng.
- Stress Analysis
Solar Resource Assessment: Technical Irradiance Fundamentals
Solar Irradiance Components: The fundamental measurement of solar energy flux density, categorized by the path and nature of the radiation reaching the earth’s surface for energy conversion modeling.
To perform a robust assessment, we must distinguish between the three primary components of solar radiation. Global Horizontal Irradiance (GHI) is the total amount of shortwave radiation received from above by a surface horizontal to the ground. It is the sum of Direct Normal Irradiance (DNI) and Diffuse Horizontal Irradiance (DHI).
DNI is the radiation coming directly from the sun without scattering by the atmosphere. This is the critical parameter for Concentrated Solar Power (CSP) and high-concentration PV systems. DHI, conversely, is the radiation scattered by clouds, aerosols, and atmospheric particles. For standard flat-plate PV, GHI is the primary driver, but DHI becomes significant during overcast conditions.
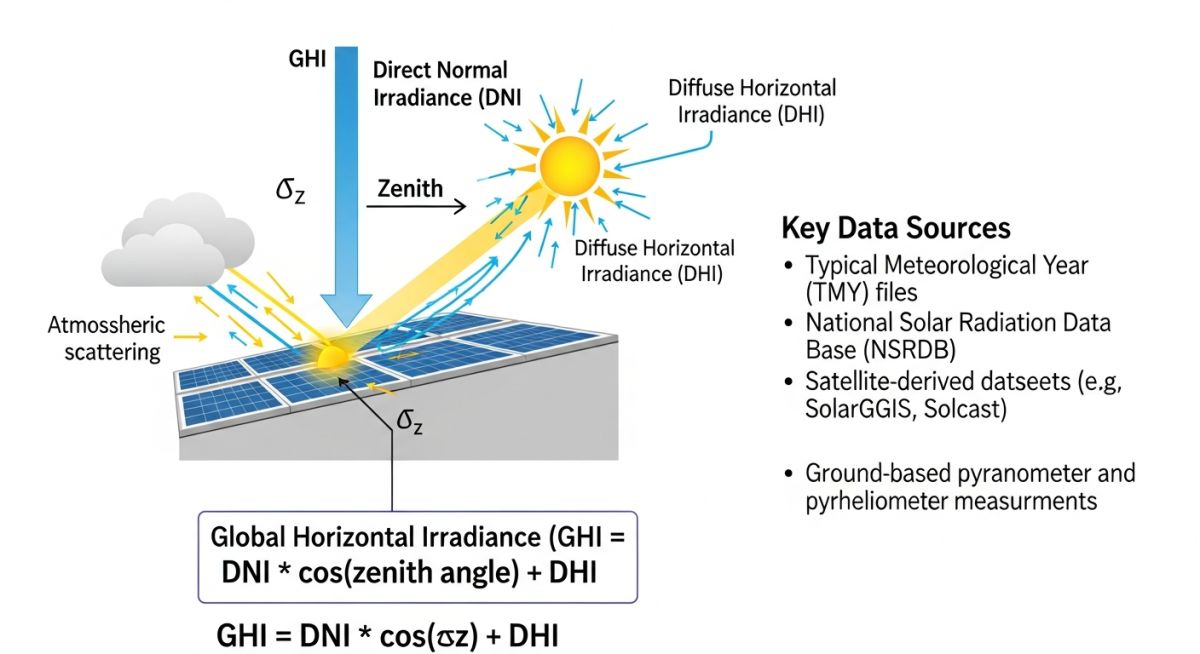
The relationship is defined by the geometric equation: GHI = DNI * cos(theta) + DHI, where theta is the solar zenith angle. In my experience, relying on satellite data alone often leads to significant errors in DNI estimation, as satellite models struggle with high-frequency atmospheric changes. For bankable projects, I always recommend installing an on-site meteorological station equipped with a thermopile pyranometer for GHI and a pyrheliometer for DNI.
Field Warning: Sensor Calibration and Maintenance
Uncalibrated sensors are the leading cause of yield estimation failure. According to ISO 9060 standards, pyranometers must be calibrated annually. Dust accumulation on the sensor dome can reduce readings by 5-10% within weeks in arid environments. Always implement a daily cleaning and maintenance protocol for your on-site meteorological mast.
When processing meteorological data, we must normalize the raw values against long-term averages (typically 20+ years). We use TMY (Typical Meteorological Year) datasets to simulate performance. However, TMY does not capture extreme weather events. Therefore, we must perform a sensitivity analysis on inter-annual variability to ensure the project remains solvent during low-resource years.
Resource Assessment Methodologies: The comparative evaluation of ground-based measurement versus satellite-derived data for determining long-term solar energy potential.
Advantages
- Ground-based data provides the highest accuracy for site-specific micro-climates.
- Reduces uncertainty in P90 yield estimates, lowering the cost of debt.
- Allows for real-time validation of satellite models during the pre-construction phase.
- Captures localized shading effects that satellite pixels (typically 1-3km) miss entirely.
Disadvantages
- High capital expenditure for high-quality meteorological mast installation and instrumentation.
- Requires ongoing operational costs for sensor cleaning, calibration, and data management.
- Data gaps due to sensor failure can invalidate months of critical measurement.
- Site-specific data may not represent the broader regional climate without long-term correlation.
Solar Resource Assessment Applications: The practical deployment of irradiance data analysis across diverse utility-scale and industrial energy infrastructure projects.
Utility-Scale PV Farm Development
Accurate GHI assessment is the cornerstone of utility-scale PV. By integrating ground-based pyranometer data with 20-year satellite trends, developers can optimize panel tilt and row spacing to maximize energy density while minimizing land footprint.
Concentrated Solar Power (CSP) Projects
CSP plants rely exclusively on DNI. Resource assessment for these projects requires high-precision pyrheliometers to track the sun’s direct beam, as even minor atmospheric haze can cause significant drops in thermal output and turbine efficiency.
Industrial Green Hydrogen Production
Green hydrogen electrolysis requires a stable, predictable power supply. Resource assessment here focuses on minimizing the “duck curve” impact by analyzing sub-hourly irradiance variability, ensuring the electrolyzer operates within its optimal efficiency window.
Accurate solar resource assessment relies on the precise measurement of irradiance components using calibrated instrumentation. In my experience, the selection of sensors is dictated by the specific technology deployed, such as Concentrated Solar Power (CSP) requiring Direct Normal Irradiance (DNI) or Photovoltaic (PV) systems focusing on Global Horizontal Irradiance (GHI). The following table outlines the primary instrumentation standards and their respective applications in utility-scale project development.
Engineers must ensure that all sensors comply with ISO 9060 classifications. Using secondary standard pyranometers is mandatory for bankable feasibility studies, as these instruments provide the lowest uncertainty levels required by financial institutions for long-term yield projections. Always verify that the calibration certificates are traceable to the World Radiometric Reference (WRR) to maintain data integrity throughout the project lifecycle.
| Irradiance Type | Instrument | Standard | Primary Application |
|---|---|---|---|
| GHI | Pyranometer | ISO 9060 | Flat-plate PV |
| DNI | Pyrheliometer | ISO 9060 | CSP / CPV |
| DHI | Shaded Pyranometer | ISO 9060 | Diffuse Fraction Analysis |
The following matrix maps the critical technical entities involved in solar resource assessment to their respective industry standards and physical parameters. Understanding these relationships is vital for engineers performing site-specific yield analysis, as it bridges the gap between raw meteorological data and the final energy production model.
Each entity listed below represents a fundamental component of the bankability process. By aligning these parameters with IEC 61724 standards, project developers can minimize technical risk and provide lenders with a transparent, defensible assessment of the site’s solar potential. This matrix serves as a quick reference for identifying the necessary inputs for P50 and P90 energy yield calculations.
| Entity | Acronym | Standard | Parameter |
|---|---|---|---|
| Global Horizontal Irradiance | GHI | IEC 61724 | W/m2 |
| Direct Normal Irradiance | DNI | IEC 61724 | W/m2 |
| Diffuse Horizontal Irradiance | DHI | IEC 61724 | W/m2 |
Conducting a thorough site assessment is the bedrock of any successful solar project. Before finalizing your resource model, you must verify the physical environment against your satellite-derived data. This checklist ensures that your on-site measurements are representative of the long-term solar resource and that your equipment is installed to meet international bankability requirements.
- ☐ Horizon Survey: Perform a 360-degree horizon profile analysis to identify potential shading from terrain or vegetation.
- ☐ Sensor Leveling: Verify that all pyranometers and pyrheliometers are perfectly leveled using high-precision bubble levels.
- ☐ Soiling Mitigation: Establish a regular cleaning schedule for sensors to prevent dust accumulation from biasing irradiance readings.
- ☐ Data Logging: Ensure the data acquisition system (DAS) is configured for 1-minute or 5-minute sampling intervals.
- ☐ Calibration Records: Confirm that all sensors have valid, current calibration certificates traceable to the WRR.
- ☐ Site Accessibility: Verify that the meteorological station location is accessible for routine maintenance and calibration checks.
In my experience, failing to account for local micro-climatic effects—such as persistent morning fog or localized cloud patterns—is the most common cause of yield estimation errors. Always cross-reference your on-site data with at least 10 years of historical satellite data to ensure that your measurement period is not an outlier. If the on-site data deviates significantly from the long-term average, you must apply a Measure-Correlate-Predict (MCP) methodology to adjust your yield estimates accordingly.
The Challenge: Inconsistent Yield Projections
A 50MW utility-scale project in a semi-arid region faced a 12% discrepancy between satellite-derived irradiance data and the first six months of on-site ground measurements.
- Unaccounted for high-altitude aerosol optical depth affecting DNI.
- Sensor soiling due to proximity to unpaved access roads.
- Inadequate leveling of the pyranometer during the initial installation phase.
- Lack of correlation between the site-specific micro-climate and regional satellite data.
The Outcome: Corrected Bankable Estimates
By implementing a rigorous recalibration and data-cleaning protocol, the project team successfully reconciled the data, leading to a more accurate and bankable energy yield model.
- Reduced uncertainty in annual energy production (AEP) from 15% to 4%.
- Improved investor confidence through transparent data validation processes.
- Established a robust long-term maintenance plan for meteorological equipment.
- Successfully secured project financing based on the refined P90 estimates.
My recommendation for similar projects is to prioritize the installation of a high-quality meteorological station at least 12 months before the final investment decision. This provides the necessary baseline to validate satellite data and account for site-specific environmental factors that satellite models often overlook. Never rely solely on satellite data for large-scale investments without ground-truth validation.
Why is DNI critical for CSP projects?
- DNI is highly sensitive to atmospheric conditions like aerosols and water vapor.
- Even minor cloud cover significantly reduces the efficiency of solar concentration.
- Accurate DNI measurement is mandatory for calculating the thermal output of the solar field.
- Standard ISO 9060 pyrheliometers are required to track the sun precisely for these measurements.
What is the difference between P50 and P90?
- P50 is the median estimate, meaning there is a 50% probability that the actual energy production will be higher or lower.
- P90 is a conservative estimate, indicating a 90% probability that the actual energy production will meet or exceed this value.
- Lenders typically require P90 estimates to ensure debt service coverage ratios are maintained during low-resource years.
- The gap between P50 and P90 is determined by the uncertainty in the solar resource data and the performance model.
How does soiling affect irradiance data?
- Soiling rates vary significantly based on local climate, wind patterns, and proximity to industrial or agricultural sites.
- Regular cleaning of pyranometer domes is required to maintain measurement accuracy.
- Automated cleaning systems or frequent manual inspections are standard for high-accuracy meteorological stations.
- Failure to account for soiling can lead to significant errors in long-term energy yield predictions.
What is the role of satellite data?
- Satellite models use cloud-cover imagery to estimate GHI and DNI across large geographic areas.
- They are invaluable for initial site screening and feasibility studies.
- Satellite data should always be validated against at least one year of high-quality ground-based measurements.
- Standardized datasets like NSRDB are commonly used for these assessments.
Why is sensor calibration important?
- Calibration must be performed annually or biennially by an accredited laboratory.
- Traceability to the World Radiometric Reference (WRR) is a fundamental requirement for bankable data.
- Uncalibrated sensors introduce systematic bias into the yield model, which can jeopardize project financing.
- Always maintain a detailed log of calibration certificates for every sensor on site.
What is the Measure-Correlate-Predict method?
- Measure: Collect high-quality ground data for a representative period (e.g., 12 months).
- Correlate: Establish a statistical relationship between the ground data and a long-term reference dataset (e.g., satellite data).
- Predict: Use the established correlation to project the long-term solar resource at the site.
- This process is critical for mitigating the risk of short-term weather anomalies impacting the project’s financial viability.

📚 Recommended Resources: Solar Resource Assessment
Read these Guides
- 📄 Utility-Scale Solar Power Plants: Design and Key Components Introduction
- 📄 Solar Panels Explained: Types, Working Principles, and Selection Criteria
- 📄 ReFuelEU Aviation and RFNBO-Based Sustainable Aviation Fuel Compliance Guide
- 📄 RFNBO Requirements for e-Methanol Projects: A Technical Compliance Guide