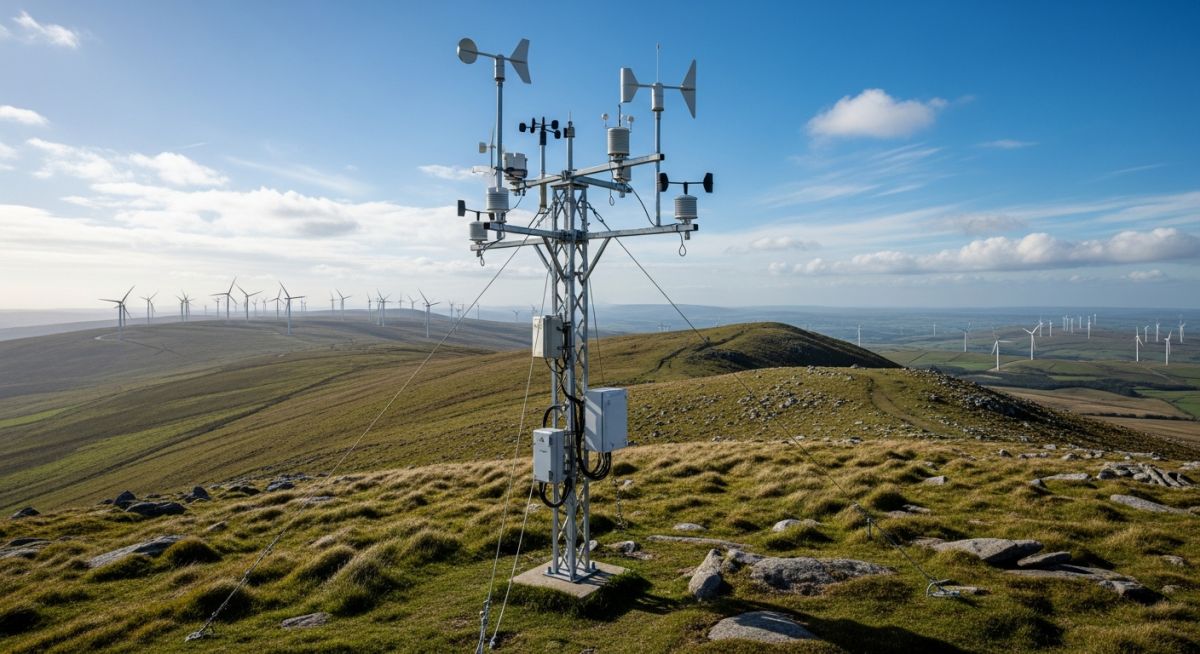
Wind Resource Assessment for Wind Power Projects
In my two decades of engineering experience, I have learned that the success of any wind farm hinges entirely on the accuracy of the initial resource assessment. It is not merely about measuring wind speed; it is about understanding the complex atmospheric dynamics that dictate the kinetic energy available for conversion. A project’s bankability is directly tied to the rigor of this assessment phase.
When we neglect the nuances of site-specific shear, air density variations, or turbulence, we invite catastrophic underperformance. This guide breaks down the technical requirements for conducting a robust assessment, from sensor calibration to long-term correlation, ensuring your project meets the stringent requirements of lenders and stakeholders alike.
Key Takeaways
- Accurate wind measurement is the primary driver of project IRR.
- LiDAR technology complements traditional Met Masts for vertical profiling.
- Long-term correlation using MCP (Measure-Correlate-Predict) is mandatory.
- Adherence to IEC standards is non-negotiable for project financing.
Technical Fundamentals of Wind Resource Assessment
Wind Resource Assessment: The rigorous application of fluid dynamics and statistical modeling to translate raw anemometry data into a bankable energy yield estimate, ensuring compliance with international site assessment protocols.
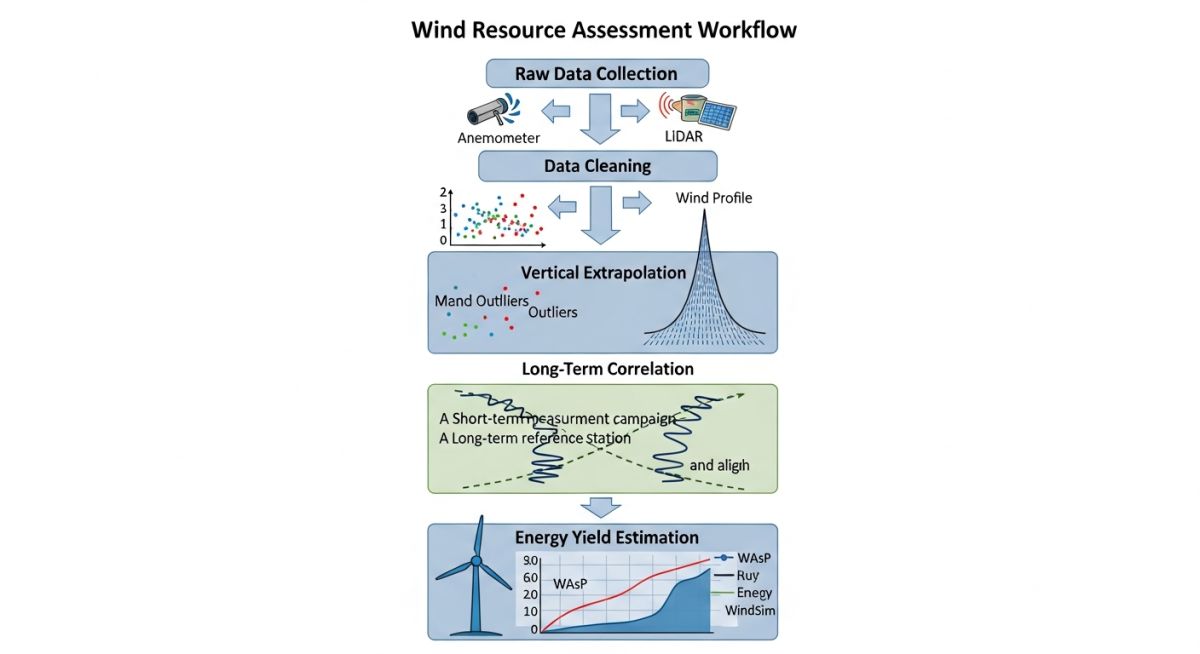
The kinetic energy of wind is defined by the power density equation, where power equals one-half times air density times the swept area times the cube of the wind speed. Because the power output is proportional to the cube of the wind speed, even a minor error in measurement—such as a 5% bias—can lead to a 15% error in predicted energy yield. This is why I emphasize the use of calibrated, high-precision cup anemometers mounted at multiple heights on a meteorological mast.
When designing the measurement campaign, we must account for wind shear, which is the variation of wind speed with height. We typically model this using the Power Law: U(z) = U(ref) * (z / z_ref)^alpha, where alpha is the shear exponent. In complex terrain, this exponent is rarely constant, necessitating the use of LiDAR (Light Detection and Ranging) to capture the vertical wind profile up to the hub height and beyond, effectively reducing the uncertainty associated with shear extrapolation.
Field Warning: Sensor Icing and Obstructions
In cold climates, rime ice accumulation on anemometer cups can lead to “frozen” data, artificially depressing the mean wind speed. Always specify heated sensors and ensure the mast is positioned to minimize wake effects from local topography or existing structures, as per IEA Wind guidelines.
Data analysis requires a robust Measure-Correlate-Predict (MCP) process. We correlate the short-term on-site data with long-term reference data from nearby meteorological stations or reanalysis datasets like MERRA-2. This allows us to normalize the site data to a long-term period, typically 10 to 20 years, to account for inter-annual variability. Without this long-term correction, the assessment remains a snapshot rather than a reliable forecast.
Finally, we must calculate the turbulence intensity (TI), defined as the ratio of the standard deviation of wind speed to the mean wind speed. High TI levels increase fatigue loads on turbine components, potentially shortening the design life of the asset. By integrating these parameters into a site-specific wind flow model, we can optimize turbine placement to maximize energy capture while staying within the structural load envelopes defined by the manufacturer.
Assessment Methodology Trade-offs: A critical evaluation of traditional mast-based measurement versus remote sensing technologies in the context of project risk mitigation and capital expenditure.
Advantages
- High-fidelity data from cup anemometers provides the industry-standard baseline for bankability.
- LiDAR allows for cost-effective vertical profiling without the need for tall, expensive masts.
- Advanced modeling reduces the P50/P90 uncertainty gap, lowering the cost of debt.
- Remote sensing enables rapid site screening in complex or inaccessible terrain.
Disadvantages
- Met masts are susceptible to physical damage and require significant permitting and logistics.
- LiDAR performance can be degraded by high aerosol concentrations or extreme precipitation.
- Initial capital expenditure for a comprehensive measurement campaign is substantial.
- Data processing requires specialized expertise to avoid systematic bias in long-term correlation.
Strategic Site Deployment: The application of wind resource assessment techniques across diverse industrial and utility-scale environments to ensure optimal energy extraction.
Utility-Scale Wind Farm Development
Large-scale projects require multi-year measurement campaigns to satisfy lender requirements for P90 energy yield estimates. We utilize a combination of 120-meter met masts and scanning LiDAR to map the wind field across the entire project boundary, ensuring that turbine micro-siting minimizes wake losses and maximizes the capacity factor.
Offshore Wind Resource Characterization
Assessing offshore wind requires floating LiDAR systems (FLiDAR) due to the prohibitive cost of fixed offshore masts. These systems must be calibrated against a reference mast and account for wave-induced motion, providing critical data on wind shear and turbulence intensity in the marine boundary layer for turbine foundation design.
Repowering Existing Wind Assets
When upgrading older wind farms, we perform a retrospective resource assessment to determine if the site’s wind potential has been fully exploited. By analyzing historical SCADA data from existing turbines and supplementing it with new, high-resolution measurement, we can justify the installation of larger, more efficient rotors and taller towers.
Selecting the correct instrumentation for a wind resource assessment campaign requires strict adherence to international standards to ensure data bankability. In my experience, the primary reference for these measurements is the IEC 61400-12-1 standard, which dictates the requirements for power performance measurements and the calibration of anemometry equipment. Engineers must account for site-specific turbulence intensity, air density variations, and the potential for icing, which can significantly skew raw wind speed data if not properly mitigated through heated sensors or ultrasonic alternatives.
The following table outlines the typical performance specifications and operational constraints for standard meteorological equipment used in modern wind farm development. These parameters are critical when performing the vertical extrapolation of wind speeds from measurement heights to the final hub height of the wind turbine generators.
| Instrument Type | Measurement Range | Accuracy (Typical) | Primary Application |
|---|---|---|---|
| Cup Anemometer | 0.5 to 75 m/s | +/- 0.1 m/s | Hub height wind speed |
| Wind Vane | 0 to 360 degrees | +/- 2 degrees | Directional frequency analysis |
| Ultrasonic Sensor | 0 to 65 m/s | +/- 2% | Turbulence and vertical flow |
| LiDAR (Ground) | 40 to 300 meters | +/- 0.5 m/s | Wind shear profile mapping |
Always ensure that your sensors are calibrated in a MEASNET-accredited wind tunnel. Using uncalibrated sensors is the fastest way to invalidate a project’s financial model during the due diligence phase of a wind power project.
The complexity of wind resource assessment requires a structured approach to data management and physical parameter tracking. By mapping specific technical entities to their respective standards and operational roles, engineering teams can maintain consistency across global project portfolios. This matrix serves as a foundational guide for integrating disparate data sources into a unified energy yield model.
When evaluating site viability, I focus on the interaction between atmospheric stability, terrain complexity, and the specific power curve of the selected turbine technology. The following matrix categorizes these critical components to assist in the systematic evaluation of site-specific wind characteristics.
| Entity | Acronym | Standard Reference | Engineering Impact |
|---|---|---|---|
| Turbulence Intensity | TI | IEC 61400-1 | Fatigue load calculation |
| Wind Shear Exponent | Alpha | Power Law Model | Vertical extrapolation accuracy |
| Air Density | Rho | ISO 2533 | Power output correction |
| Roughness Length | Z0 | Log Law Model | Surface friction estimation |
Maintaining this matrix throughout the project lifecycle allows for rapid sensitivity analysis. If the measured roughness length deviates from the initial site model, the energy yield estimate must be recalculated immediately to reflect the actual site conditions.
Before finalizing any wind resource assessment, I conduct a rigorous site verification process to ensure the data collected is representative of the long-term wind climate. This involves cross-referencing on-site measurements with satellite-derived data and long-term regional meteorological stations. The following checklist outlines the essential steps for validating your site data before it is used for bankable energy yield assessments.
-
01.
Verify sensor calibration certificates against MEASNET requirements for all anemometers and vanes. -
02.
Check for physical obstructions within the 500-meter radius of the met mast to ensure compliance with IEC 61400-12-1 siting criteria. -
03.
Perform a data recovery analysis to ensure at least 95% uptime over a minimum 12-month measurement period. -
04.
Validate the vertical wind shear profile by comparing data from multiple heights on the mast. -
05.
Confirm that the data logger time-stamping is synchronized with UTC to avoid seasonal time-shift errors. -
06.
Document all maintenance events, including sensor replacements or logger resets, in the site logbook.
By strictly following these verification steps, you minimize the uncertainty in your wind resource assessment. Remember that lenders and investors prioritize data quality above all else; a well-documented, verified dataset is the most effective tool for securing project financing and reducing the risk premium associated with wind energy development.
In a recent project involving a wind farm located in highly complex, mountainous terrain, our team encountered significant discrepancies between the initial CFD (Computational Fluid Dynamics) model and the actual wind speed measurements. This case study highlights the importance of integrating LiDAR technology to validate flow models in non-homogeneous environments.
The Challenge: Flow Separation and Turbulence
- Initial models underestimated the impact of ridge-line flow separation.
- Turbulence intensity levels exceeded the design class of the selected turbines.
- Standard mast measurements were insufficient to capture the vertical wind shear profile.
- High terrain complexity led to significant flow inclination angles.
The Outcome: Optimized Site Layout
- LiDAR deployment provided high-resolution vertical wind profiles across the site.
- CFD model recalibration reduced the energy yield uncertainty by 4.5%.
- Turbine micro-siting was adjusted to avoid high-turbulence zones.
- Project bankability was secured through improved data confidence.
My recommendation for similar projects is to always deploy remote sensing equipment early in the campaign. Relying solely on a single met mast in complex terrain is a high-risk strategy that often leads to significant energy production shortfalls during the operational phase.
What is the minimum duration for a wind resource assessment?
- Extending the campaign to 24 months to reduce inter-annual variability uncertainty.
- Using long-term reference data from nearby meteorological stations to perform MCP (Measure-Correlate-Predict) analysis.
- Ensuring the measurement period covers at least one full cycle of local weather patterns.
How does LiDAR technology improve energy yield estimation?
- Direct measurement of wind shear at the top and bottom of the rotor sweep.
- Reduced reliance on empirical power law models that may not hold in complex terrain.
- Ability to move the device across the site to map spatial wind variations.
What is the significance of turbulence intensity in site assessment?
- Shorten the operational lifespan of the turbine gearbox and blades.
- Require the selection of a higher IEC wind class turbine, which increases capital expenditure.
- Impact the power curve performance, particularly in the high-wind speed regime.
How do I handle missing data in my wind dataset?
- Using correlation with secondary sensors on the same mast to fill short-term gaps.
- Applying MCP techniques using long-term reference data for extended outages.
- Documenting all gap-filling procedures in the final resource assessment report for transparency.
What is the role of air density in energy yield?
- Overestimation of energy production at high-altitude sites.
- Underestimation of production at cold, sea-level sites.
- Incorrect power curve adjustments according to IEC 61400-12-1.
Why is bankability a key consideration in assessment?
- Independent verification of the data and methodology.
- Transparent uncertainty analysis, including P50 and P90 estimates.
- Adherence to internationally recognized standards and best practices.
Complete Course on
Piping Engineering
Check Now
Key Features
- 125+ Hours Content
- 500+ Recorded Lectures
- 20+ Years Exp.
- Lifetime Access
Coverage
- Codes & Standards
- Layouts & Design
- Material Eng.
- Stress Analysis

📚 Recommended Resources: Wind Resource Assessment
Read these Guides
- 📄 Offshore Wind Farm Engineering: Design, Foundations, and Electrical Systems
- 📄 Onshore Wind Farms: Engineering Design, Components, and Site Selection Criteria
- 📄 Wind Turbine Explained: Components, Working and Design Introduction
- 📄 Wind Energy Explained: A Comprehensive Engineering Guide for Professionals