
Understanding Borehole Logs: A Practical Guide for Engineers
In my two decades of experience, I have seen countless foundation failures that could have been avoided by a more rigorous interrogation of the initial site investigation report. A borehole log is not merely a collection of numbers; it is the primary narrative of the earth beneath your project. When I review these logs, I look past the basic soil classification to understand the stress history, drainage characteristics, and potential for liquefaction that will dictate the structural integrity of the entire facility.
This guide serves as your technical roadmap for navigating the complexities of subsurface data. We will move beyond the surface-level descriptions to analyze how SPT results, groundwater fluctuations, and sampling methods interact to influence your final design decisions.
Key Takeaways for Engineers
- Master the correlation between N-values and soil relative density.
- Identify critical groundwater table fluctuations that impact buoyancy and excavation stability.
- Learn to spot inconsistencies in field logs that suggest poor sampling techniques.
- Understand the limitations of visual-manual classification versus laboratory testing.
Technical Analysis of Borehole Logs and Subsurface Data
Subsurface Data Interpretation: The technical process of correlating field-derived penetration resistance with laboratory-verified soil parameters to define the geotechnical design model for structural foundations.
When I analyze a borehole log, I begin by verifying the consistency of the Standard Penetration Test (SPT) results. Per ASTM D1586, the N-value represents the number of blows required to drive the sampler 300mm into the soil. However, I always apply energy corrections (N60) to account for hammer efficiency, which is vital for accurate liquefaction potential assessments. If the hammer efficiency is not explicitly stated, I assume a conservative 60% efficiency, but I always cross-reference this with the driller’s equipment logs.
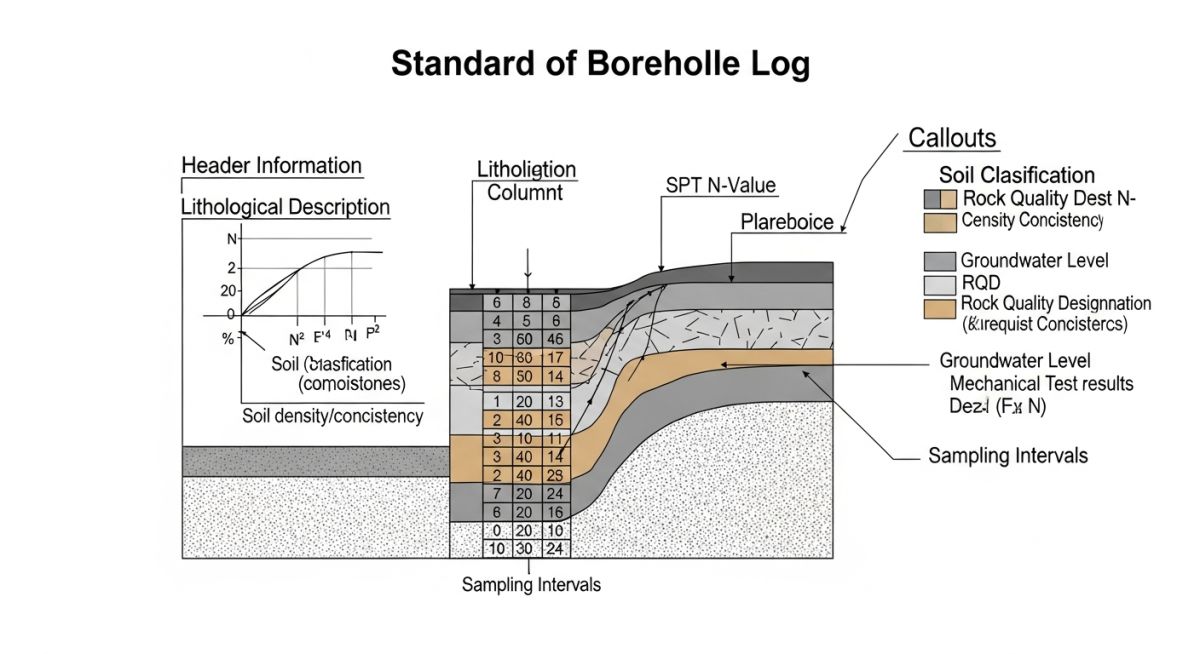
Soil description in the log must follow the Unified Soil Classification System (USCS). I look for the distinction between primary and secondary constituents. For instance, a “silty sand” behaves fundamentally differently than a “sandy silt” under cyclic loading. The moisture content, often recorded as “dry,” “moist,” or “saturated,” provides the first clue regarding the soil’s drainage capacity. If the log indicates “saturated” in a fine-grained soil, I immediately flag it for potential consolidation settlement issues.
Field Warning: The “Refusal” Trap
Engineers often mistake “refusal” (N > 50) for bedrock. In my experience, this is frequently a boulder or a dense cobble layer. Always check the core recovery percentage and Rock Quality Designation (RQD) before assuming you have reached competent bearing strata. If the RQD is low despite high blow counts, you are likely dealing with weathered rock or large obstructions, not a solid foundation base.
Groundwater information is the most volatile variable in any borehole log. A single reading is insufficient. I require seasonal high and low water table data to calculate the effective stress profile. If the log shows a water level that fluctuates significantly, I must account for the change in effective unit weight of the soil, which directly impacts the bearing capacity calculations using Terzaghi’s or Meyerhof’s equations.
Finally, I scrutinize the sampling information. Was the sample disturbed or undisturbed? A Shelby tube sample provides a much more reliable estimate of undrained shear strength than a split-spoon sample. If the log relies solely on split-spoon samples for cohesive soils, I treat the shear strength parameters with extreme caution and recommend additional vane shear testing or laboratory triaxial tests.
Borehole Log Utility: The evaluation of site-specific subsurface data to balance the cost of investigation against the risk of structural foundation failure.
Advantages
- Provides a direct, physical record of subsurface stratigraphy.
- Allows for correlation of soil strength with empirical N-values.
- Enables precise identification of groundwater table depth.
- Facilitates the collection of samples for laboratory index testing.
- Reduces uncertainty in foundation settlement predictions.
Disadvantages
- High cost associated with deep drilling and mobilization.
- Data is limited to the specific borehole location (point data).
- Susceptible to human error in visual-manual classification.
- Disturbed samples can lead to inaccurate shear strength estimates.
- Time-consuming process that can delay project commencement.
Geotechnical Site Characterization: The application of borehole log data to define the engineering properties of soil and rock for diverse industrial and civil infrastructure projects.
Deep Foundation Design
Borehole logs are essential for determining the skin friction and end-bearing capacity of pile foundations. By analyzing the N-values and soil types at various depths, I can optimize pile length and diameter to ensure the structure remains within allowable settlement limits under both static and dynamic loads.
Excavation and Shoring Stability
For deep excavations, the borehole log provides the necessary data to model lateral earth pressures and groundwater inflow rates. This allows for the design of robust shoring systems, such as diaphragm walls or sheet piles, preventing catastrophic wall collapse or base heave during construction.
Liquefaction Mitigation Strategies
In seismic zones, I use the SPT N-values from borehole logs to calculate the Cyclic Stress Ratio (CSR) and Cyclic Resistance Ratio (CRR). This analysis is critical for identifying liquefiable soil layers and designing ground improvement techniques like stone columns or vibro-compaction to mitigate the risk of soil strength loss during an earthquake.
Interpreting borehole logs requires a standardized approach to correlate field observations with laboratory testing data. As an engineer, I rely on these parameters to establish the soil profile and determine the allowable bearing capacity for shallow or deep foundation systems. The table below outlines the critical correlation factors between field-measured Standard Penetration Test (SPT) N-values and relative density or consistency, which are foundational to ASTM D1586 compliance.
When reviewing these values, always account for overburden pressure corrections, especially in granular soils where the effective stress significantly influences the N-value. Failure to normalize these results can lead to an overestimation of soil strength, potentially compromising the structural safety factor of your foundation design.
| Soil Type | SPT N-Value (Blows/ft) | Relative Density/Consistency | Estimated Phi (Degrees) |
|---|---|---|---|
| Granular (Sand) | 0-4 | Very Loose | Less than 28 |
| Granular (Sand) | 10-30 | Medium Dense | 30-36 |
| Cohesive (Clay) | 2-4 | Very Soft | N/A |
| Cohesive (Clay) | 16-32 | Very Stiff | N/A |
The following matrix maps essential geotechnical entities to their respective industry standards and physical parameters. This mapping is vital for maintaining consistency across multi-disciplinary engineering reports, ensuring that data extracted from borehole logs is interpreted using the correct empirical relationships defined by ASCE and ISO standards.
By utilizing this matrix, engineers can quickly identify the governing standard for specific soil or rock properties, reducing the risk of misinterpretation during the site investigation phase. Always verify that the laboratory testing methods align with the field sampling techniques documented in the log.
| Entity | Standard Reference | Key Parameter |
|---|---|---|
| SPT Testing | ASTM D1586 | N-Value |
| Rock Quality | ASTM D6032 | RQD Percentage |
| Soil Classification | ASTM D2487 | USCS Group Symbol |
Borehole Log Verification: Ensuring the accuracy of field data is the first step in structural reliability. Use this checklist to validate that your site investigation logs meet the rigorous requirements of modern geotechnical engineering practice.
- Coordinate Accuracy: Verify that the borehole location coordinates match the site survey plan within a 0.5-meter tolerance.
- Groundwater Stabilization: Confirm that groundwater levels were recorded after a minimum 24-hour stabilization period per ASTM standards.
- Sample Recovery: Check that the percentage of sample recovery is documented for every interval, especially in soft cohesive soils.
- Drilling Method: Ensure the drilling method (e.g., hollow stem auger vs. mud rotary) is explicitly stated, as this impacts N-value interpretation.
- RQD Calculation: Validate that the Rock Quality Designation (RQD) was calculated using only core pieces greater than 100mm in length.
If any of these items are missing or ambiguous, request a supplemental report from the geotechnical contractor before finalizing your foundation design. In my experience, the most common failures in foundation performance stem from relying on incomplete borehole logs that lack critical groundwater or recovery data.
The Problem: Inconsistent SPT Data in Alluvial Deposits
- Significant scatter in N-values observed across three adjacent boreholes.
- Lack of documentation regarding the drilling fluid pressure during the SPT test.
- Discrepancy between visual soil classification and laboratory sieve analysis results.
- Potential for liquefaction risk assessment to be skewed by uncorrected blow counts.
The Outcome: Remediation and Data Normalization
- Implemented energy calibration for the SPT hammer to normalize N-values to N60.
- Conducted additional CPT (Cone Penetration Testing) to bridge the data gaps.
- Revised the foundation design to account for the lower-bound soil strength parameters.
- Established a robust site-specific correlation between N-values and shear wave velocity.
My recommendation for similar scenarios is to always prioritize CPT data when SPT results show high variability in alluvial or heterogeneous soil profiles. This dual-method approach provides a much higher degree of confidence in the final geotechnical model.
Frequently Asked Engineering Questions
Why is the N-value corrected to N60?
- Different hammer types (safety, donut, automatic) deliver varying percentages of theoretical energy.
- N60 normalizes these variations to 60 percent of the theoretical free-fall energy.
- This correction is required by ASTM D1586 to ensure consistent soil strength correlations.
- Without this, comparing data from different drilling rigs would lead to significant errors in bearing capacity calculations.
How does RQD influence rock mass quality?
- It is defined as the sum of core pieces longer than 100mm divided by the total core run length.
- High RQD values indicate competent rock, while low values suggest highly fractured or weathered zones.
- Engineers use RQD to estimate the rock mass modulus and determine foundation settlement potential.
- Always cross-reference RQD with joint spacing and weathering descriptions for a complete rock mass assessment.
What is the significance of groundwater readings?
- Fluctuating water tables can significantly impact the bearing capacity of shallow foundations.
- High groundwater levels may necessitate dewatering during construction or the use of waterproof basements.
- Pore water pressure measurements are essential for slope stability and liquefaction analysis.
- Always note the time of measurement, as seasonal variations can be substantial in many geological environments.
How do I interpret USCS soil symbols?
- The first letter denotes the primary soil type (G for gravel, S for sand, M for silt, C for clay).
- The second letter describes the gradation or plasticity (W for well-graded, P for poorly graded, L for low plasticity, H for high plasticity).
- These symbols are essential for predicting soil behavior, such as permeability and compressibility.
- Refer to ASTM D2487 for the complete classification criteria and laboratory testing requirements.
Why is sample recovery percentage important?
- Low recovery often suggests that the soil was too soft or loose to be captured effectively by the sampler.
- It can also indicate poor drilling technique or excessive wash-out during the sampling process.
- If recovery is low, the laboratory test results may not be representative of the in-situ soil conditions.
- Always document recovery to provide context for the strength and density parameters reported in the log.
What are common errors in borehole logs?
- Misidentification of soil types due to lack of field testing or laboratory verification.
- Inaccurate recording of groundwater levels, often failing to account for stabilization time.
- Failure to document drilling fluid losses or changes in drilling rate, which are key indicators of subsurface conditions.
- Inconsistent use of terminology, leading to confusion between different borehole logs on the same project.
Complete Course on
Piping Engineering
Check Now
Key Features
- 125+ Hours Content
- 500+ Recorded Lectures
- 20+ Years Exp.
- Lifetime Access
Coverage
- Codes & Standards
- Layouts & Design
- Material Eng.
- Stress Analysis

📚 Recommended Resources: Borehole Logs
Read these Guides
- 📄 Optimizing Borehole Quantity and Location for Geotechnical Site Investigations
- 📄 How to Read and Interpret Geotechnical Investigation Reports for Engineers
- 📄 Preparing a Comprehensive RFP for Geotechnical Investigations: Expert Guide
- 📄 Geotechnical and Topographical Surveys: A Complete Guide for Engineers