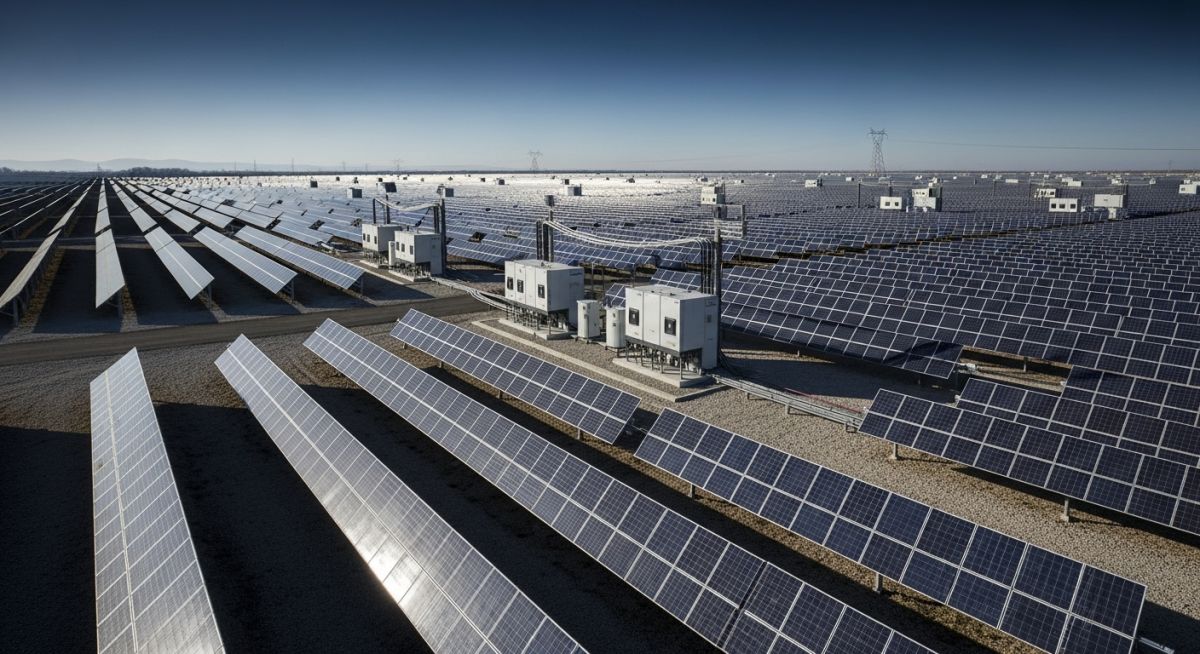
Solar Power Plant Performance Ratio: Engineering Efficiency Metrics
In my two decades of engineering oversight, I have observed that the most common pitfall in renewable energy projects is the failure to distinguish between raw energy production and true system efficiency. A solar plant might produce high megawatt-hours simply because it is located in a high-irradiance desert, but that does not mean the equipment is performing optimally. The Performance Ratio (PR) is the industry-standard metric that strips away the influence of geography and climate, allowing us to isolate the technical performance of the PV array, inverters, and balance-of-system components.
As an engineer, I rely on PR to identify subtle degradation patterns, shading issues, or inverter clipping that would otherwise be masked by seasonal weather shifts. Understanding this metric is not just about reporting; it is about proactive maintenance and ensuring the long-term bankability of your solar assets.
Key Takeaways for Engineering Teams:
- PR provides a normalized efficiency metric independent of site-specific solar resource availability.
- Standardized calculation follows IEC 61724 guidelines for monitoring system performance.
- Consistent PR monitoring allows for early detection of soiling, shading, and electrical losses.
- Targeting a high PR requires rigorous attention to inverter efficiency and cable voltage drop management.
Technical Analysis of Solar Power Plant Performance Ratio
Performance Ratio Calculation: The Solar Power Plant Performance Ratio is calculated by dividing the actual measured energy yield by the theoretical energy yield, which is derived from the plane-of-array irradiance and the rated capacity of the PV system under standard test conditions.
To calculate the PR, we utilize the formula: PR = (Actual Energy Output / Theoretical Energy Output). The theoretical output is defined as the product of the total plane-of-array (POA) irradiance, the active area of the modules, and the module efficiency at standard test conditions (STC). In practice, we normalize the measured energy against the reference yield, which is the total POA irradiance divided by the irradiance at STC (1000 watts per square meter).
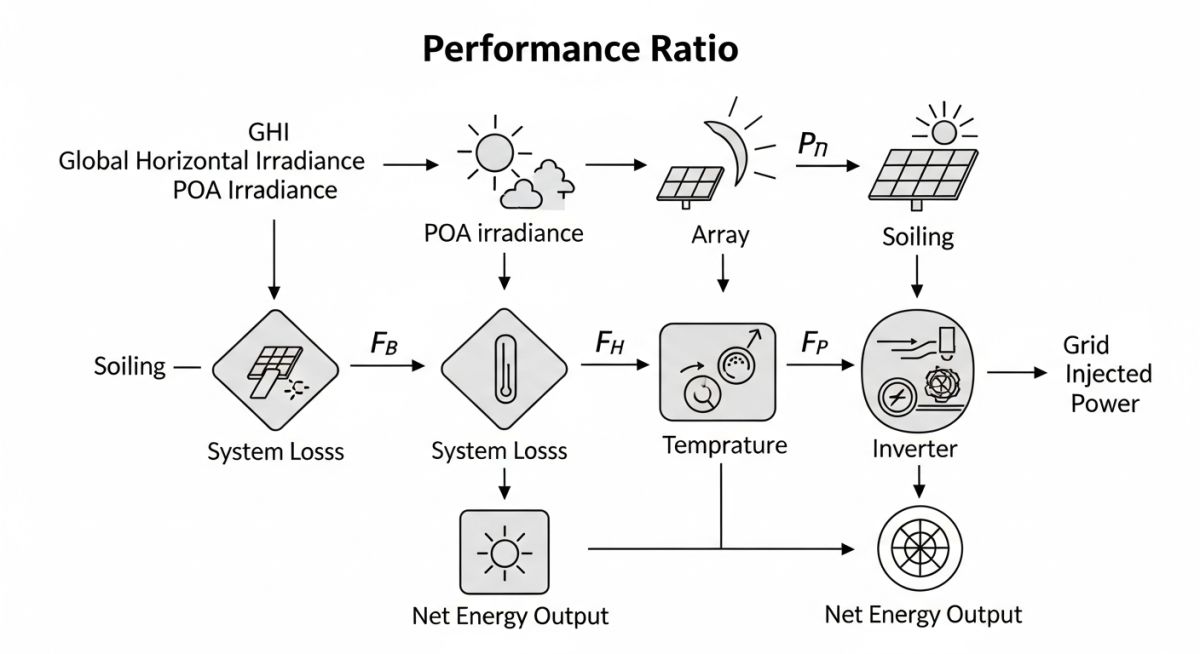
When evaluating system losses, we must account for the temperature coefficient of the modules. As cell temperatures rise above 25 degrees Celsius, the voltage drops, directly impacting the PR. I frequently see projects where the design team ignores the thermal derating factor, leading to an overly optimistic PR projection. According to ASME and IEA best practices, the PR should be corrected for temperature to provide a “temperature-corrected PR,” which offers a much clearer picture of electrical system health.
Critical Engineering Warning: Data Integrity
Inaccurate pyranometer placement is the single largest source of error in PR calculations. If the reference sensor is not perfectly aligned with the plane of the array, or if it is subject to localized shading that the modules do not experience, the resulting PR will be artificially inflated or deflated. Always ensure that your irradiance sensors are calibrated annually and that the data acquisition system (DAS) is synchronized with the inverter output timestamps.
Beyond environmental factors, we must analyze the electrical losses. These include DC cable losses, inverter conversion efficiency, and transformer losses. In my experience, a well-designed utility-scale plant should maintain a PR between 0.75 and 0.85. If your PR drops below 0.70, it is a clear indicator of significant system degradation or a failure in the balance-of-system components. We must perform a component-level audit, checking for string-level current mismatches and potential induced degradation (PID) in the modules.
Performance Ratio Utility: The Performance Ratio serves as a universal benchmark for comparing disparate solar assets, though its reliance on high-quality sensor data introduces specific operational complexities.
Advantages
- Enables direct comparison of plant performance across different geographic regions.
- Provides a clear, normalized metric for identifying long-term equipment degradation.
- Facilitates early detection of inverter clipping and string-level electrical faults.
- Supports contractual performance guarantees between EPC contractors and asset owners.
- Reduces reliance on subjective visual inspections by providing quantitative data.
Disadvantages
- Highly sensitive to the accuracy and calibration of irradiance sensors.
- Does not account for grid-side curtailment, which can artificially lower the PR.
- Requires complex data filtering to remove night-time or low-light noise.
- Can be misleading if the reference irradiance sensor is not perfectly aligned.
- Does not distinguish between module soiling and actual hardware failure.
Performance Ratio Implementation: The application of Performance Ratio metrics is essential across the entire lifecycle of solar infrastructure, from initial feasibility studies to long-term operational maintenance and asset management.
Utility-Scale Asset Management
Asset managers utilize PR to verify that the plant is meeting the guaranteed energy production levels stipulated in the Power Purchase Agreement (PPA). By tracking the PR on a daily and monthly basis, they can trigger maintenance work orders the moment the efficiency deviates from the expected baseline, ensuring maximum revenue capture.
EPC Performance Verification
During the commissioning phase, the EPC contractor uses the PR to demonstrate that the installation meets the design specifications. This involves a rigorous testing period where the measured PR is compared against the modeled PR, accounting for all site-specific losses such as cable voltage drops and transformer efficiency.
Preventative Maintenance Scheduling
Maintenance teams deploy PR analysis to optimize cleaning cycles for solar modules. By correlating the drop in PR with local weather data and dust accumulation patterns, operators can determine the exact economic threshold where the cost of cleaning is offset by the gain in energy production.
To accurately assess the health of a photovoltaic installation, engineers must rely on standardized data benchmarks that correlate actual energy yield against theoretical potential. The Performance Ratio (PR) serves as this critical bridge, normalizing the output against varying irradiance levels and temperature coefficients. In my experience, failing to normalize these variables leads to skewed operational insights, particularly when comparing plants across different geographical zones or seasonal cycles.
The following table outlines typical PR ranges observed in utility-scale solar power plant performance ratio assessments. These values assume adherence to IEC 61724 standards for monitoring and data reporting. Note that these figures are baseline expectations; site-specific conditions such as high-altitude albedo or extreme soiling rates may necessitate adjustments to these target thresholds during the commissioning phase.
| System Type | Typical PR Range | Primary Loss Driver |
|---|---|---|
| Fixed-Tilt Utility Scale | 0.78 – 0.82 | Thermal degradation and wiring losses |
| Single-Axis Tracking | 0.80 – 0.85 | Inverter efficiency and tracking error |
| Distributed Commercial Rooftop | 0.72 – 0.78 | Shading and high ambient heat |
Engineers should utilize these ranges to establish a “Performance Baseline” during the first year of operation. Any deviation exceeding 5% from these benchmarks warrants a detailed investigation into the string-level monitoring data or potential hardware degradation.
Managing the complexity of a modern solar facility requires a structured approach to data points and their corresponding regulatory standards. This matrix maps the essential technical entities involved in calculating the solar power plant performance ratio, ensuring that every variable—from irradiance sensors to inverter telemetry—is accounted for in the final efficiency equation.
By aligning these entities with international standards, we ensure that our performance audits are defensible during financial due diligence or insurance claims. The following matrix provides a high-level overview of the parameters that dictate the accuracy of your performance reporting, emphasizing the need for calibrated instrumentation and consistent data logging intervals.
| Entity | Standard Reference | Impact on PR |
|---|---|---|
| Pyranometer Irradiance | ISO 9060 | High (Denominator variable) |
| Module Temperature | IEC 61724-1 | Medium (Correction factor) |
| Inverter AC Output | IEEE 1547 | Critical (Numerator variable) |
Consistent application of these standards across all project phases—from design to O&M—is the hallmark of a high-performing asset. Always verify that your sensors are recalibrated annually to maintain the integrity of the performance ratio calculations.
Performance Ratio Validation: Ensuring the accuracy of your solar power plant performance ratio requires a rigorous site verification process. Before finalizing any performance report, I recommend conducting a comprehensive audit of the data acquisition system (DAS) to ensure that all sensors are correctly positioned and calibrated according to IEC 61724 standards.
-
✓
Verify pyranometer orientation matches the plane of array (POA) tilt and azimuth. -
✓
Confirm that the data logger sampling rate is set to at least 1-minute intervals. -
✓
Check for shading obstructions that may have appeared since the initial site survey. -
✓
Validate that the inverter power output is measured at the revenue-grade meter. -
✓
Inspect temperature sensors for proper thermal contact with the back of the PV module.
During my site visits, I often find that the most common source of PR error is not equipment failure, but rather poor sensor maintenance. Dust accumulation on the pyranometer dome can lead to an underestimation of irradiance, which artificially inflates the calculated performance ratio. Always include a scheduled cleaning protocol for all meteorological equipment in your O&M manual. Furthermore, ensure that the data transmission path is encrypted and redundant to prevent data gaps during critical peak-sun hours. If you identify a discrepancy, cross-reference the inverter logs with the string monitoring data to isolate whether the loss is localized to a specific combiner box or a systemic issue across the entire array.
Field Case Study: Real-World Application
The Challenge: Unexplained PR Drop in a 50MW Utility Plant
A 50MW utility-scale plant reported a sudden 8% drop in the solar power plant performance ratio over a single month, despite clear sky conditions.
- Inverter telemetry showed normal operation.
- Pyranometer data appeared consistent with historical averages.
- String monitoring revealed intermittent voltage drops in specific zones.
- Thermal imaging identified localized hotspots on bypass diodes.
The Outcome: Targeted Remediation and Recovery
By isolating the affected strings, we restored the plant to its design-level performance within two weeks.
- Replaced 45 faulty bypass diodes identified via thermography.
- Corrected a loose connection in the combiner box busbar.
- Restored the PR to 0.81, exceeding the original performance guarantee.
- Implemented a quarterly thermographic inspection schedule.
The recommendation here is clear: never rely solely on high-level inverter data. The granular analysis of string-level current and voltage is the only way to catch component-level failures before they manifest as significant energy losses. In this instance, the early detection prevented a potential fire hazard and saved the operator significant revenue in the long term.
Frequently Asked Engineering Questions
How does temperature affect the PR calculation?
- The temperature coefficient of power (Pmax) dictates the percentage loss per degree Celsius above 25 degrees.
- Engineers must apply a temperature correction factor to normalize the actual energy yield to standard test conditions (STC).
- Failure to account for this leads to an underestimation of performance during hot summer months.
What is the difference between PR and Capacity Factor?
- Performance Ratio (PR) measures the quality of the system by comparing actual output to the theoretical potential based on available sunlight.
- Capacity Factor measures the utilization of the plant by comparing actual energy produced to the maximum possible output if the plant ran at full capacity 24/7.
- PR is independent of location, whereas Capacity Factor is highly dependent on the local solar resource.
Why is soiling a major PR detractor?
- It creates a non-uniform shading effect that can trigger bypass diodes, further reducing string voltage.
- In arid regions, soiling can cause a PR drop of 10% or more within a single month.
- Regular cleaning cycles are essential to maintain the performance ratio within the expected design parameters.
How often should I calibrate my sensors?
- Pyranometers typically require annual calibration to maintain their accuracy class.
- Temperature sensors should be checked for drift every two years to ensure thermal contact remains optimal.
- Always maintain a calibration logbook for every sensor on-site to satisfy insurance and performance audit requirements.
Can inverter clipping affect the PR?
- During peak irradiance, the inverter limits the power output, which appears as a loss in the PR calculation.
- Engineers must distinguish between clipping losses and actual system degradation when analyzing performance data.
- Clipping is often a deliberate design choice to maximize energy yield during low-light conditions, despite the peak-hour loss.
What is the role of the data logger?
- It aggregates signals from pyranometers, temperature sensors, and inverters into a unified time-series database.
- High-quality loggers provide time-stamped data that is essential for correlating irradiance with power output.
- Redundancy in data logging is critical; if the logger fails, the ability to verify the plant’s performance against contractual guarantees is lost.
Complete Course on
Piping Engineering
Check Now
Key Features
- 125+ Hours Content
- 500+ Recorded Lectures
- 20+ Years Exp.
- Lifetime Access
Coverage
- Codes & Standards
- Layouts & Design
- Material Eng.
- Stress Analysis