Table of Contents
Wastewater Treatment: Process Steps, Design Considerations, and Plant Types
In my 20+ years of designing piping systems and treatment facilities, I have learned that wastewater is not just “dirty water”—it is a highly dynamic, corrosive, and complex fluid matrix. When we design a wastewater treatment plant, we are balancing fluid dynamics, biological kinetics, and chemical thermodynamics. If you get the hydraulics wrong, your biological reactors starve or drown. If you select the wrong piping materials, sewer gases like hydrogen sulfide will eat through your infrastructure in less than five years.
This guide breaks down the core mechanics of modern wastewater systems, providing the exact mathematical formulas, design parameters, and field-tested strategies required to build high-performing, compliant treatment plants.
Key Takeaways for Project Engineers
- Understand the critical role of preliminary screening in protecting downstream rotating equipment.
- Master the biological kinetics of activated sludge systems, including hydraulic and solids retention times.
- Learn how to mitigate hydrogen sulfide corrosion using advanced piping material selection.
- Discover the design differences between municipal sewage plants and industrial wastewater facilities.
- Acquire field-tested verification checklists to ensure your designs pass regulatory audits.
Understanding Wastewater Treatment Process Steps and Design
Wastewater Treatment Process Steps: The systematic progression of physical, chemical, and biological unit operations designed to reduce biochemical oxygen demand, total suspended solids, and pathogens in accordance with international environmental standards.
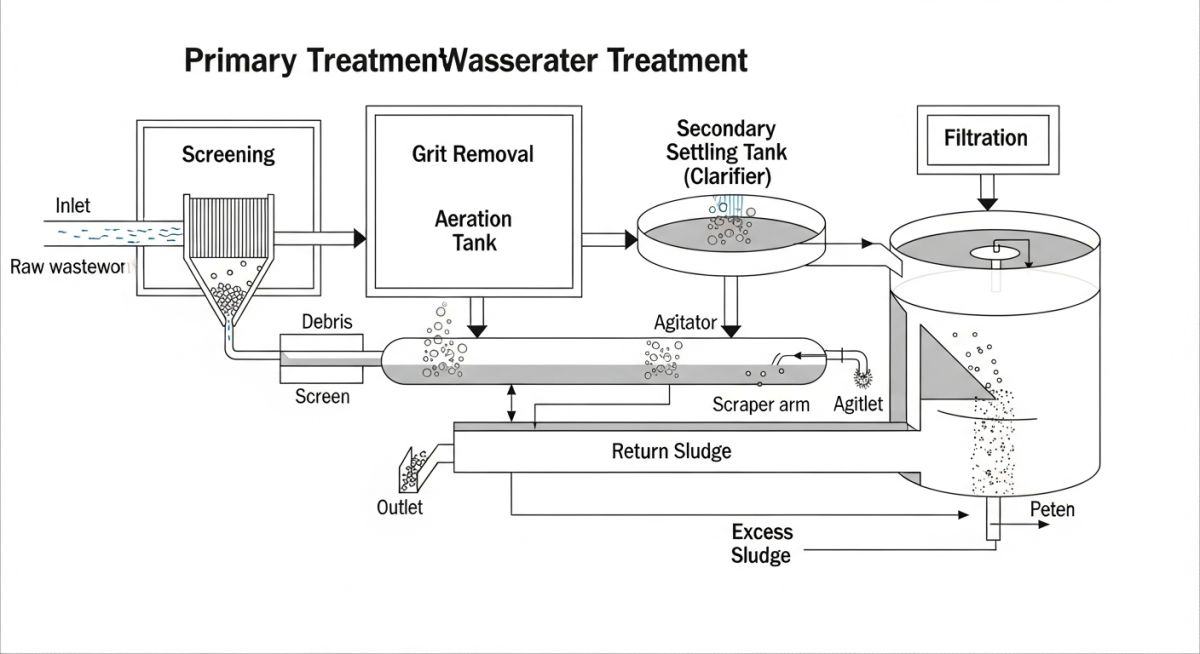
To design an effective facility, we must break down the treatment train into its fundamental stages. Each stage has a specific engineering objective, and failure at any step cascades downstream, ultimately leading to permit violations or equipment damage.
1. Preliminary Treatment: Protecting the Infrastructure
The primary goal here is to remove large debris (rags, wood, plastics) and heavy inorganic solids (sand, gravel) that can clog piping or abrade pump impellers. We achieve this through bar screens and grit chambers. In my projects, I always insist on automated mechanical screens with a clear opening of 6mm to 20mm for fine screens.
2. Primary Treatment: Physical Sedimentation
This stage relies on gravity. By reducing the flow velocity, we allow heavy organic solids to settle to the bottom as primary sludge, while grease and oil float to the surface as scum. A well-designed primary clarifier should remove 50% to 70% of Total Suspended Solids (TSS) and 25% to 40% of Biochemical Oxygen Demand (BOD).
3. Secondary Treatment: Biological Purification
This is the heart of the plant. We use microorganisms (mainly bacteria) to consume dissolved organic matter. The most common configuration is the Activated Sludge Process (ASP). Here, we must carefully balance the oxygen supply, food (BOD), and biomass concentration (Mixed Liquor Suspended Solids – MLSS).
If the Food-to-Microorganism (F/M) ratio drops too low, filamentous bacteria will outgrow floc-forming bacteria. This causes “sludge bulking,” where the sludge refuses to settle in the secondary clarifier, leading to massive biomass carryover into the effluent. Keep your F/M ratio strictly within the design limits shown below.
Core Engineering Calculations
When sizing these systems, we rely on several key mathematical relationships. Let us look at the four most critical formulas:
HRT = V / Q
Where: V = Basin Volume (cubic meters), Q = Influent Flow Rate (cubic meters per hour).
SRT = (V * MLSS) / ((Q_w * WAS) + (Q_e * TSS_e))
Where: MLSS = Mixed Liquor Suspended Solids (mg/L), Q_w = Waste Sludge Flow Rate (m3/d), WAS = Waste Activated Sludge Concentration (mg/L), Q_e = Effluent Flow Rate (m3/d), TSS_e = Effluent Suspended Solids (mg/L).
F/M = (Q * BOD_influent) / (V * MLSS)
Where: BOD_influent = Influent BOD concentration (mg/L). Typical target is 0.05 to 0.15 d-1 for extended aeration.
SOR = Q / A
Where: A = Clarifier Surface Area (square meters). Must not exceed 1.2 to 1.6 m/h during peak hourly flows.
4. Tertiary and Advanced Treatment
To meet stringent discharge permits, we must often remove nutrients (nitrogen and phosphorus) and perform high-level filtration. Disinfection is the final step, utilizing chlorine contact chambers or ultraviolet (UV) disinfection systems designed in compliance with US EPA Guidelines.
Key Design Parameters for Wastewater Treatment
Design Parameters: The quantitative engineering criteria, including hydraulic loading rates and organic loading limits, used to size treatment units under ASME and EPA guidelines.
| Process Unit | Design Parameter | Typical Range (Metric) | Engineering Significance |
|---|---|---|---|
| Grit Chamber | Horizontal Velocity | 0.25 to 0.35 m/s | Prevents organic deposition while settling heavy grit. |
| Primary Clarifier | Surface Overflow Rate | 30 to 50 m3/m2/day | Governs physical settling efficiency of suspended solids. |
| Aeration Basin | MLSS Concentration | 1,500 to 4,500 mg/L | Maintains adequate biological population for organic removal. |
| Secondary Clarifier | Solids Loading Rate | 4 to 6 kg/m2/hour | Prevents overloading of the sludge blanket during peak flows. |
| UV Disinfection | UV Dose | 30 to 40 mJ/cm2 | Ensures pathogen inactivation without chemical addition. |
Technical Mapping & Specifications Matrix
The following matrix maps core technical entities, structural acronyms, and physical parameters to their governing standards.
| Entity / Acronym | Full Technical Name | Primary Physical Unit | Governing Standard / Reference |
|---|---|---|---|
| BOD5 | 5-Day Biochemical Oxygen Demand | mg/L (Milligrams per Liter) | Standard Methods 5210B |
| TSS | Total Suspended Solids | mg/L | Standard Methods 2540D |
| RAS | Return Activated Sludge | m3/day (Flow Rate) | WEF Manual of Practice 8 |
| DO | Dissolved Oxygen | mg/L | EPA Method 360.1 |
| H2S | Hydrogen Sulfide Gas | ppm (Parts per Million) | ASME B31.3 (Corrosion) |
How to Verify Wastewater Treatment Plant Designs?
Design Verification: The systematic engineering review process used to validate hydraulic capacities, piping layouts, and equipment selections against field operating conditions and regulatory permits.
Before signing off on any wastewater treatment plant design, I run through a rigorous verification protocol. This checklist ensures that the piping, hydraulics, and process interfaces are fully optimized and safe for long-term operation.
Engineering Verification Checklist
-
Hydraulic Profile Validation: Verify that the hydraulic grade line (HGL) maintains gravity flow through the plant during peak wet weather flow (PWWF) conditions without flooding upstream basins.
-
Piping Material Compatibility: Ensure all sludge lines use ductile iron with protective epoxy linings or high-density polyethylene (HDPE) to resist chemical attack and abrasion.
-
Velocity Limits in Sludge Piping: Confirm that sludge piping velocities are kept between 0.9 m/s (to prevent settling) and 2.4 m/s (to prevent excessive friction loss and shearing of biological flocs).
-
Aeration System Turndown: Check that the blowers have sufficient turndown capacity to match minimum diurnal oxygen demands without surging, in compliance with ASME PTC 10.
-
Chemical Feed Redundancy: Ensure all critical chemical dosing systems (coagulants, polymers, disinfectants) feature 100% standby redundancy (duty/standby configuration).
Field Case Study: Real-World Application
The Problem: Hydraulic Washout and Sludge Bulking
A municipal wastewater plant in Ohio designed for an average flow of 15,000 m3/day experienced severe sludge washouts during heavy rainstorms. The secondary clarifiers were losing their sludge blankets, causing effluent TSS to spike to 85 mg/L, far exceeding their permit limit of 20 mg/L. In addition, poor aeration control led to low dissolved oxygen (DO) levels, triggering a massive outbreak of filamentous bacteria that caused severe sludge bulking.
The Solution & Engineering Outcome
I was brought in to audit the facility. We implemented a two-phase remediation plan. First, we retrofitted the aeration basins with automated DO control loops using variable frequency drives (VFDs) on the blowers, maintaining a steady DO of 2.0 mg/L. Second, we modified the secondary clarifier feed wells to reduce inlet turbulence and installed a polymer feed system to improve sludge flocculation during peak flows.
As a result, the sludge volume index (SVI) dropped from 250 mL/g to a highly stable 95 mL/g. The plant successfully handled the next major storm event without any biomass loss, keeping effluent TSS below 8 mg/L.
My Recommendation: Never design your aeration basins with fixed-speed blowers. Always utilize VFDs paired with real-time DO probes. The energy savings alone will pay for the upgrade within 18 months, and the operational stability it provides is priceless.
Frequently Asked Engineering Questions
What is the difference between BOD and COD in wastewater design?
Why is hydrogen sulfide corrosion such a major issue in wastewater piping?
How does an MBR system differ from a conventional activated sludge system?
What is the purpose of Return Activated Sludge (RAS)?
How do we design for phosphorus removal in wastewater treatment?
What are the typical piping velocity limits for raw wastewater?
===FAQ_BLOCK===
Complete Course on
Piping Engineering
Check Now
Key Features
- 125+ Hours Content
- 500+ Recorded Lectures
- 20+ Years Exp.
- Lifetime Access
Coverage
- Codes & Standards
- Layouts & Design
- Material Eng.
- Stress Analysis

📚 Recommended Resources: Wastewater Treatment
Read these Guides


Related posts:
![Side-by-side 3D render of a centrifugal pump and a positive displacement gear pump showing internal components.]()
Mastering Centrifugal Pump vs Positive Displacement Pump Selection
![Industrial worker reviewing a Material Safety Data Sheet on a tablet near chemical storage.]()
What is Material Safety Data Sheet (MSDS)? | MSDS VS SDS
![An offshore crude oil drilling rig operating in the ocean at sunset.]()
Understanding Crude Oil Price and Types for Piping Design
![Steel sucker rod string being installed at an oil well pumpjack site.]()
What is a Sucker Rod? Its Types and Critical Importance
![Cutaway diagram of a fire-safe ball valve showing primary and secondary metal-to-metal seals.]()
What is Fire-Safe Valve? API 607 vs API 6FA
![A maintenance engineer inspecting industrial machinery with a digital diagnostic overlay.]()
Optimizing Plant Reliability with the Core Types of Maintenance