Understanding the Stress-Strain Curve for Robust Piping and Structural Design
In my 20 years of piping engineering, I have seen many young engineers treat material selection as a simple lookup task. They open a datasheet, grab the yield strength, and plug it into their stress analysis software. But a single number does not tell the whole story. To design systems that withstand extreme thermal cycles, high pressures, and seismic events, you must understand the complete mechanical profile of your materials. That profile is captured entirely within the stress-strain curve.
I remember a high-pressure steam line project where a subcontractor substituted a specified grade of stainless steel with a cheaper alloy. On paper, their yield strengths looked comparable. However, their behavior beyond the yield point—their plastic deformation and strain-hardening characteristics—was vastly different. Under thermal expansion, the substituted line suffered localized necking and eventual rupture. This failure could have been avoided if the team had analyzed the complete stress-strain curve rather than relying on a single data point.
- Understand the transition from elastic to plastic deformation to prevent permanent piping distortion.
- Differentiate between engineering stress-strain and true stress-strain for high-strain applications.
- Identify how different materials—like aluminum, cast iron, and elastomers—behave under load to select the correct design margins.
- Apply ASME B31.3 and ASME Section VIII standards to translate raw material curves into safe allowable stress limits.
Complete Course on
Piping Engineering
Check Now
Key Features
- 125+ Hours Content
- 500+ Recorded Lectures
- 20+ Years Exp.
- Lifetime Access
Coverage
- Codes & Standards
- Layouts & Design
- Material Eng.
- Stress Analysis
How is the Stress-Strain Curve Generated?
Tensile Testing Generation: The stress-strain curve is plotted using standardized uniaxial tensile testing on specimen geometries governed by ASTM E8/E8M specifications.
To generate this curve, a standardized specimen is placed in a Universal Testing Machine (UTM). The machine applies a controlled, progressive tensile load while simultaneously measuring the applied force and the elongation of the specimen’s gauge length.
We calculate engineering stress by dividing the instantaneous load by the original cross-sectional area of the specimen. Engineering strain is calculated by dividing the change in gauge length by the original gauge length. The formulas are expressed as:
Engineering Strain (ε) = ΔL / L₀
Where:
• P is the applied tensile load (Newtons or Pounds-force)
• A₀ is the original cross-sectional area (square millimeters or square inches)
• ΔL is the change in gauge length (L – L₀)
• L₀ is the original gauge length
In high-strain applications, such as pipeline hot-tapping or plastic collapse analysis, engineering stress and strain become inaccurate because they do not account for the changing cross-sectional area. In these scenarios, we must use true stress and true strain:
True Strain (ε_t) = ln(1 + ε)
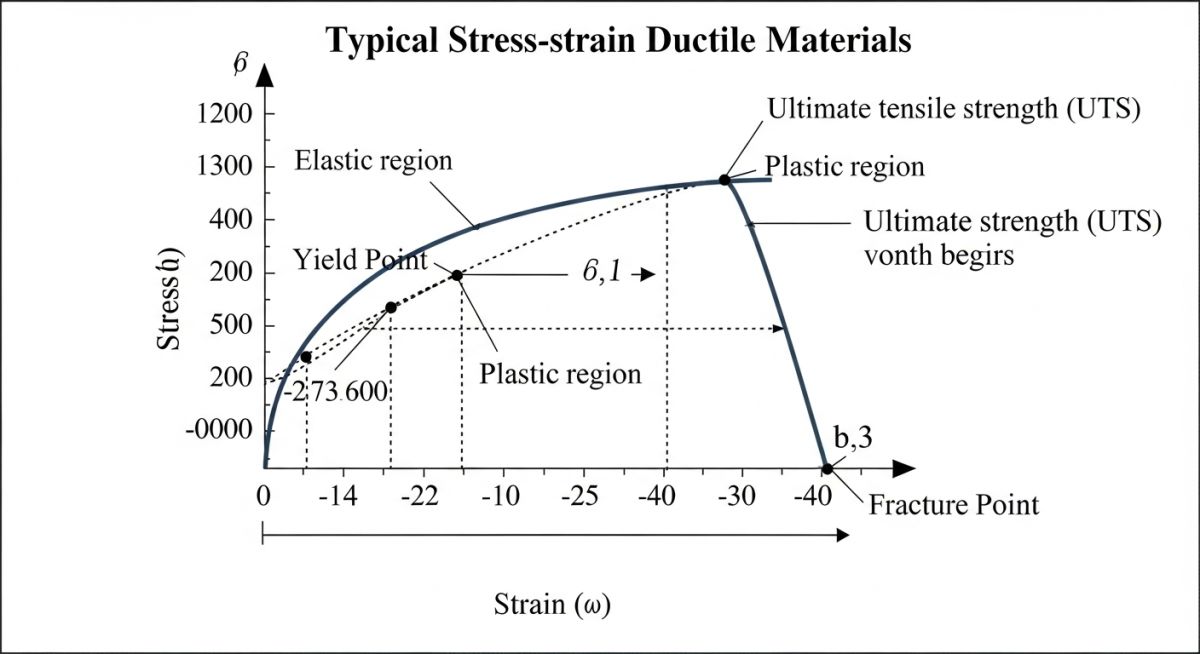
Yield Strength: Defining Elastic Limits
Yield Strength Limit: This parameter marks the transition from elastic deformation to permanent plastic deformation, typically determined by a 0.2 percent offset method under ASTM standards.
Below the yield strength, the material behaves elastically. If you remove the load, the material returns to its original shape. Once the stress exceeds the yield point, atomic planes slip past one another, causing permanent, irreversible plastic deformation. For materials without a distinct yield point, we draw a line parallel to the elastic region starting at a strain of 0.002 (0.2%) to find the offset yield strength.
Ultimate Tensile Strength: Peak Capacity
Ultimate Tensile Strength: This value represents the maximum engineering stress a material can withstand before necking occurs under uniaxial tensile loading.
The Ultimate Tensile Strength (UTS) is the highest point on the engineering stress-strain curve. Beyond this point, the material can no longer distribute the strain uniformly. Deformation concentrates in a localized region, causing a rapid reduction in cross-sectional area known as “necking.” Even though the material continues to strain-harden locally, the engineering stress drops because it is calculated using the original area.
Young’s Modulus: Measuring Material Stiffness
Young’s Modulus Value: This slope of the linear elastic region quantifies a material’s intrinsic stiffness and resistance to elastic deformation under axial load.
Young’s Modulus (E), or the modulus of elasticity, is defined by Hooke’s Law in the linear elastic region: E = σ / ε. A higher Young’s Modulus means the material is stiffer and will deform less under a given load. For example, carbon steel has a Young’s Modulus of approximately 200 GPa, whereas aluminum is around 69 GPa. This difference is critical when designing piping spans to limit deflection and prevent sagging.
Why the Stress-Strain Curve Matters in Piping
Piping Design Application: Engineers utilize the stress-strain curve to establish allowable stress limits, prevent catastrophic plastic collapse, and calculate thermal expansion stresses under ASME B31.3.
In piping design, we use the stress-strain curve to establish the allowable stress limits defined in codes like ASME B31.3. For instance, the basic allowable stress for carbon steel at design temperature is typically limited to the lower of 2/3 of the yield strength or 1/3 of the ultimate tensile strength. This safety margin ensures that the piping system operates safely within its elastic region, preventing permanent deformation or rupture.
Never use ambient-temperature mechanical properties for high-temperature piping designs. As temperature increases, the stress-strain curve flattens out. Both the yield strength and Young’s Modulus drop significantly. Failing to account for this temperature derating will lead to excessive thermal expansion stresses, localized yielding, and eventual system failure. Always reference the temperature-dependent values in ASME Section II Part D.
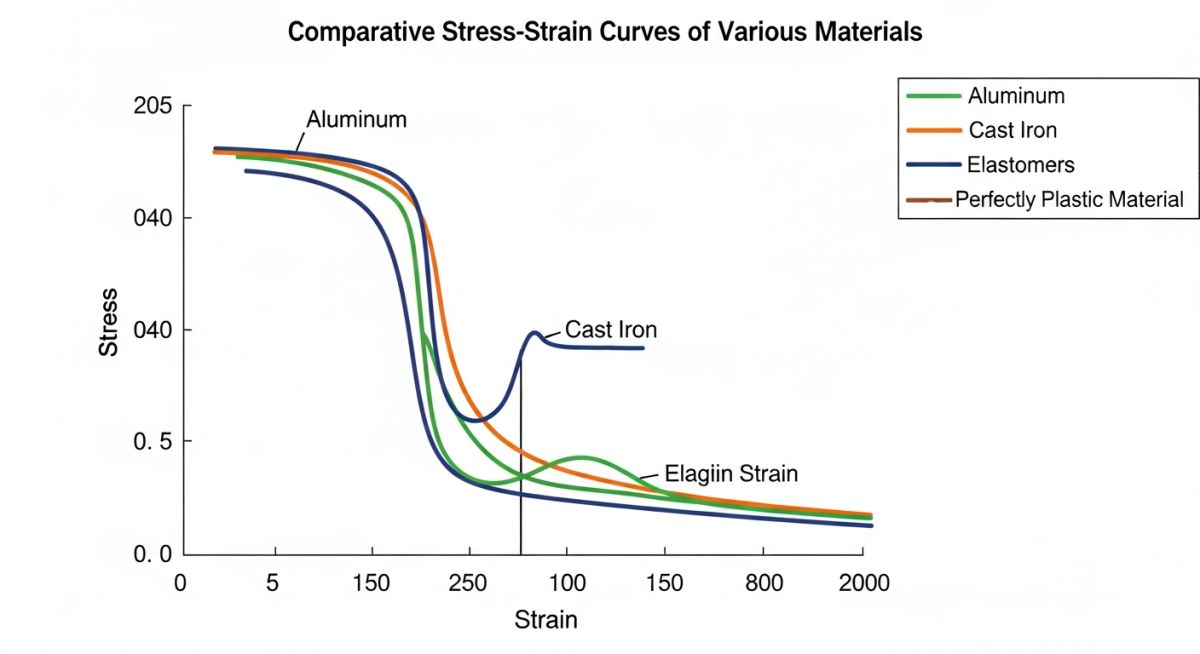
Stress-Strain Curve of Aluminum Alloys
Aluminum Alloy Behavior: Aluminum exhibits a continuous transition from elastic to plastic states without a distinct yield point, requiring the 0.2 percent offset yield strength determination.
Unlike carbon steel, which often shows a sharp, distinct yield point drop, aluminum alloys transition smoothly from elastic to plastic behavior. This smooth curve makes it difficult to pinpoint the exact moment yielding begins. Therefore, we rely on the 0.2% offset method. Aluminum also has a lower modulus of elasticity (approx. 69 GPa), meaning it will deflect three times more than steel under the same load and geometry. This high flexibility must be managed with closer support spacing in piping systems.
Stress-Strain Curve for Cast Iron Materials
Cast Iron Characteristics: Gray cast iron displays a non-linear elastic region and negligible plastic deformation, failing in a brittle manner directly at its ultimate tensile limit.
Gray cast iron is a classic brittle material. Its stress-strain curve does not have a defined linear elastic region or a yield point. Instead, it curves slightly from the start and terminates abruptly at the fracture point with almost zero plastic deformation. Because of this brittle nature, ASME B31.3 places strict limitations on the use of cast iron in hazardous or high-pressure services, as it offers no warning (such as visible bulging or stretching) before catastrophic failure.
Stress-Strain Curve for Elastomeric Polymers
Elastomer Mechanical Response: Elastomers undergo large, non-linear elastic deformations up to several hundred percent strain, characterized by a sigmoidal stress-strain curve.
Elastomers, such as those used in piping gaskets and expansion joints, behave very differently from metals. Their stress-strain curve is highly non-linear and often takes a sigmoidal (S-shaped) form. They can stretch up to 500% or more and still return to their original shape. This behavior is driven by the uncoiling of polymer chains rather than the stretching of atomic bonds. When designing gaskets, we must ensure the compressive stress remains within the optimal sealing range of this curve to prevent over-compression and extrusion.
Stress-Strain Curve for Perfectly Plastic Materials
Perfect Plasticity Model: This idealized material model assumes infinite plastic deformation at a constant yield stress level without any strain hardening.
An elastic-perfectly plastic material model is an idealization used in advanced finite element analysis (FEA) and limit-load design. In this model, the material behaves elastically up to its yield strength. Once it reaches the yield point, it deforms infinitely at that constant stress level without any strain hardening. While no real metal behaves exactly this way, this conservative model is highly useful for calculating the collapse load of structural components and piping systems under extreme loads.
The table below summarizes the key mechanical properties derived from the stress-strain curves of common piping and structural materials. These values are critical for performing stress analysis and ensuring compliance with ASME codes.
| Material Specification | Yield Strength (MPa) | Tensile Strength (MPa) | Young’s Modulus (GPa) | Elongation at Break (%) | ASME Code Reference |
|---|---|---|---|---|---|
| ASTM A106 Grade B (Carbon Steel) | 240 | 415 | 203 | 30% | ASME Sec II Part D |
| ASTM A312 TP304 (Stainless Steel) | 205 | 515 | 193 | 35% | ASME Sec II Part D |
| Aluminum 6061-T6 | 276 | 310 | 68.9 | 12% | ASME Sec II Part D |
| ASTM A48 Class 30 (Gray Cast Iron) | N/A (Brittle) | 207 | 103 | <1% | ASME Sec II Part D |
This matrix maps the core mechanical parameters of the stress-strain curve to their corresponding engineering applications, design codes, and physical implications.
| Parameter / Acronym | Physical Meaning | Primary Design Application | Governing Standard |
|---|---|---|---|
| YS (Yield Strength) | Stress at which permanent plastic deformation begins. | Setting primary membrane stress limits. | ASTM E8/E8M |
| UTS (Ultimate Tensile Strength) | Maximum engineering stress before localized necking. | Determining burst pressure and safety margins. | ASTM E8/E8M |
| E (Young’s Modulus) | Slope of the linear elastic region (stiffness). | Calculating piping deflection and thermal expansion. | ASTM E111 |
| % Elongation | Measure of material ductility before fracture. | Evaluating suitability for cold bending and seismic loading. | ASTM E8/E8M |
Verifying Material Properties on Site
Material Verification Protocol: This field checklist ensures that delivered piping and structural components match the design stress-strain curve parameters specified in the project datasheets.
Before installing any piping or structural components, you must verify that the physical materials delivered to the site match the engineering design assumptions. This checklist outlines the critical verification steps to prevent material mix-ups and ensure code compliance.
-
Review Mill Test Reports (MTRs):
Verify that the MTR lists the actual yield strength, ultimate tensile strength, and elongation values. Confirm these values meet or exceed the minimum requirements of the material specification (e.g., ASTM A106 Gr. B). -
Cross-Reference Heat Numbers:
Physically match the heat numbers stamped on the pipes, fittings, and flanges with the heat numbers listed on the certified MTRs. -
Perform Positive Material Identification (PMI):
For alloy and stainless steel piping, use a handheld PMI analyzer to verify the chemical composition matches the specified grade before welding. -
Inspect for Physical Damage:
Check for surface defects, gouges, or localized deformation that could act as stress concentrators and prematurely initiate necking or cracking. -
Verify Hardness Limits:
For sour service applications (NACE MR0175/ISO 15156), perform field hardness testing to ensure the material has not been over-hardened, which reduces ductility and increases susceptibility to cracking.
Field Case Study: Real-World Application
During the commissioning of a high-temperature steam line (operating at 450°C), a stainless steel piping loop suffered severe localized deformation and sagging. The design team had performed stress analysis using the ambient-temperature Young’s Modulus (193 GPa) and ambient yield strength (205 MPa). They failed to account for the dramatic shift in the stress-strain curve at elevated temperatures, where the actual Young’s Modulus dropped to 158 GPa and the yield strength fell to 115 MPa. As a result, the thermal expansion stresses exceeded the actual high-temperature yield point, causing permanent plastic deformation.
I was brought in to lead the root cause analysis. We immediately modeled the system using the temperature-derated stress-strain curve parameters from ASME Section II Part D. We replaced the permanently deformed piping sections and redesigned the support system. By replacing rigid supports with variable spring hangers and adding an expansion loop, we reduced the thermal expansion stresses to well below the derated yield strength. The line has now been operating safely for over five years without any further deformation.
This case highlights why you must never treat mechanical properties as static values. Always evaluate the stress-strain curve at your actual operating conditions to ensure the system remains safely within its elastic limits.
Frequently Asked Engineering Questions
What is the difference between engineering stress and true stress?
How does temperature affect the stress-strain curve of steel?
Why do we use a 0.2% offset to determine yield strength?
What is the physical meaning of the area under the stress-strain curve?
How does strain hardening affect a material’s behavior?
Which ASME code governs material properties for stress analysis?

📚 Recommended Resources: stress-strain curve
Read these Guides
🎓 Advanced Training


Related posts:
![Professional surveyor conducting Topographical Surveys for Solar Projects on a large-scale utility site with complex terrain.]()
Topographical Surveys for Solar Projects: A Technical Engineering Guide
![A geotechnical drill rig performing soil sampling on a large, open field intended for a utility-scale solar farm project.]()
Geotechnical Investigation for Solar Farms: Essential Site Design Guide
![Isometric site plan showing Utility Corridor Planning for Data Centres with color-coded power, water, and telecom infrastructure paths.]()
Utility Corridor Planning for Data Centres: A Strategic Engineering Guide
![Aerial view of a data centre site showcasing perimeter drainage systems, detention basins, and site grading for flood prevention.]()
Drainage Design Considerations for Data Centres: A Technical Guide
![Professional surveyor using a Total Station on a large data centre construction site for topographical mapping.]()
Topographical Surveys for Data Centre Projects: A Technical Guide
![Cross-section diagram showing Ground Improvement for Data Centres using stone columns and deep soil mixing beneath a concrete foundation slab.]()
Ground Improvement for Data Centres: Engineering Stability and Settlement Control