Solar Power Plant Economics and LCOE Introduction
In my two decades of experience managing large-scale infrastructure projects, I have learned that the technical design of a solar plant is inseparable from its financial architecture. Many engineers focus exclusively on peak efficiency, yet the true success of a project is measured by its Levelized Cost of Electricity (LCOE). Understanding how CAPEX and OPEX interact within the project lifecycle is the difference between a profitable asset and a stranded one.
This guide breaks down the complex variables that influence solar project economics. We will move beyond simple payback periods to analyze the nuanced drivers of long-term returns, ensuring your technical decisions align with rigorous financial modeling standards.
Key Takeaways
- Master the fundamental components of LCOE calculation for utility-scale solar.
- Differentiate between initial CAPEX and recurring OPEX to optimize asset lifecycle.
- Identify the primary cost drivers that impact project internal rate of return (IRR).
- Align engineering specifications with bankable financial models for project success.
Solar Power Plant Economics and LCOE Analysis
Solar Power Plant Economics: The comprehensive framework for assessing the total cost of ownership and energy production capacity, governed by ASTM E2848 standards for performance reporting and IEC 61724 for monitoring.
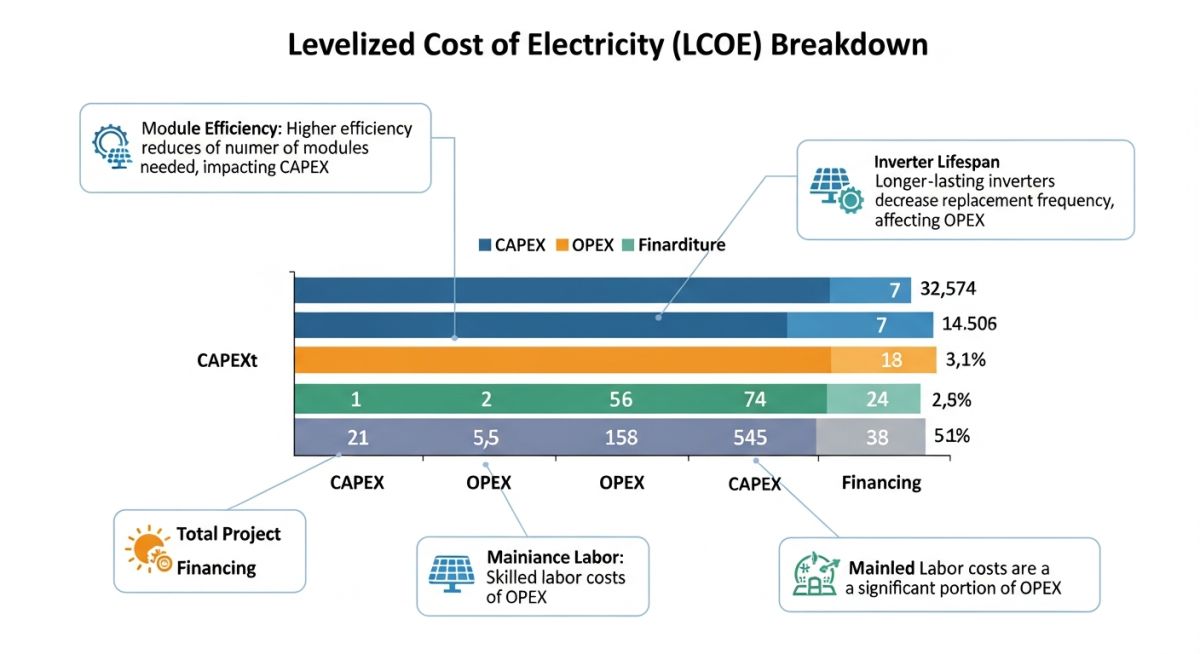
To calculate the LCOE, we must aggregate all costs over the project lifetime and divide by the total energy generated. The formula is essentially the sum of discounted costs divided by the sum of discounted energy production. In my practice, I emphasize that the discount rate is the most sensitive variable in this equation, often dictated by the project’s risk profile and debt-to-equity ratio.
CAPEX Components and Engineering Constraints
Capital Expenditure (CAPEX) represents the upfront investment required to bring a plant to commercial operation. This includes module procurement, racking systems, inverters, and balance-of-system (BOS) components. From a structural engineering perspective, the racking system is a primary cost driver. We must balance wind load requirements, as defined by ASCE 7-22, against material costs to avoid over-engineering.
OPEX and Long-Term Asset Management
Operational Expenditure (OPEX) covers the ongoing costs of maintaining the plant, including cleaning, vegetation management, inverter replacements, and insurance. A common mistake is underestimating the impact of soiling on energy yield. In arid environments, the cost of automated cleaning robots versus manual labor must be modeled against the potential revenue loss from reduced irradiance.
Furthermore, inverter reliability is a critical factor. While string inverters offer modularity, central inverters often provide better economies of scale for utility-scale projects. We must evaluate the Mean Time Between Failures (MTBF) for these components to ensure that the OPEX budget remains stable over the 25-year design life of the plant.
Solar Economic Trade-offs: The strategic evaluation of financial and operational benefits versus inherent project risks in utility-scale solar development.
Advantages
- Predictable long-term cash flows through Power Purchase Agreements (PPAs).
- Low operational risk due to the absence of moving parts in PV modules.
- Scalability allows for modular expansion based on capital availability.
- Significant tax incentives and renewable energy credits (RECs) improve IRR.
- Minimal fuel price volatility compared to thermal power generation assets.
Disadvantages
- High initial capital intensity requires significant upfront financing.
- Intermittency necessitates investment in storage or grid balancing solutions.
- Land acquisition and permitting processes can cause lengthy project delays.
- Performance degradation over time requires ongoing monitoring and maintenance.
- Sensitivity to interest rate fluctuations impacts the cost of debt capital.
Solar Economic Implementation: The practical application of financial modeling and engineering design across diverse industrial and utility sectors.
Utility-Scale Grid Integration
Large-scale solar farms provide bulk power to the national grid, requiring complex interconnection studies and high-voltage substation design. These projects leverage economies of scale to achieve the lowest possible LCOE, often serving as the primary baseload replacement in regions with high solar irradiance.
Industrial Feedstock Decarbonization
Manufacturing facilities utilize on-site solar arrays to offset high electricity costs and meet corporate sustainability targets. By integrating behind-the-meter solar, these plants reduce transmission losses and hedge against rising utility tariffs, directly improving the facility’s operational margin.
Remote Microgrid Electrification
In off-grid mining or remote industrial operations, solar-plus-storage systems replace expensive diesel generation. The economic model here focuses on the displacement of fuel costs, where the high initial CAPEX is justified by the rapid reduction in logistics and fuel procurement expenses.
In my two decades of managing utility-scale energy projects, I have observed that the accuracy of financial modeling hinges on the granular breakdown of cost components. When evaluating the economic viability of a solar installation, we must categorize expenditures into initial capital investments and recurring operational outlays. The following table provides a standardized breakdown of these cost drivers, which are essential for calculating the Levelized Cost of Electricity (LCOE) accurately according to NREL guidelines.
Engineers must distinguish between fixed costs, which remain constant regardless of energy output, and variable costs that fluctuate based on performance degradation or maintenance requirements. By utilizing these benchmarks, project managers can perform sensitivity analyses to identify which cost categories pose the greatest risk to the internal rate of return (IRR). Always ensure that your cost estimates account for regional labor variations and local grid interconnection requirements, as these often deviate from global averages.
| Cost Category | Component Description | Financial Impact |
|---|---|---|
| PV Modules | Tier-1 monocrystalline silicon panels | High CAPEX (30-40% of total) |
| Inverters | Central or string inverter systems | Moderate CAPEX / Replacement risk |
| BOS (Balance of System) | Racking, cabling, and transformers | High CAPEX (Labor intensive) |
| O&M Services | Cleaning, monitoring, and repairs | Annual OPEX (Fixed/Variable) |
The following matrix maps the critical technical entities involved in solar project finance to their respective industry standards and performance metrics. As an engineer, I rely on these mappings to ensure that our financial models align with the physical realities of the plant’s lifecycle. Understanding the relationship between these entities is vital for risk mitigation and long-term asset management.
Each entity listed below represents a specific node in the IEA framework for renewable energy deployment. By standardizing these definitions, we reduce the ambiguity often found in project feasibility studies. Ensure that your technical documentation references these specific standards to maintain compliance with international project finance requirements and bankability criteria.
Solar Power Plant Economics: Verification of site-specific economic parameters is a fundamental step in ensuring that the projected LCOE remains valid throughout the project lifecycle. In my experience, failing to account for site-specific variables like soil resistivity, local labor costs, and grid interconnection distance is the primary cause of budget overruns. This checklist serves as a technical audit tool for project managers and engineers to validate their financial assumptions before reaching the Final Investment Decision (FID).
-
Geotechnical Assessment: Confirm soil stability and drainage to avoid unexpected foundation costs during the construction phase. -
Interconnection Distance: Validate the distance to the nearest substation; every additional kilometer significantly increases the CAPEX for cabling and transformers. -
Irradiance Data: Utilize TMY (Typical Meteorological Year) data from reliable sources like NREL to ensure yield projections are not overly optimistic. -
Permitting and Regulatory Fees: Account for local land-use taxes and environmental impact assessment costs which vary by jurisdiction. -
O&M Logistics: Verify the availability of local maintenance crews to minimize response times for inverter failures or panel cleaning.
By systematically reviewing these items, you ensure that your financial model is grounded in reality rather than theoretical assumptions. Always document the source of your data for each checklist item to facilitate the due diligence process with lenders and investors. A transparent, well-documented economic model is the most effective way to secure competitive financing rates for your solar project.
Problem: Unexpected CAPEX Inflation in a 50MW Utility-Scale Project
- Inaccurate assessment of local soil conditions led to foundation redesigns.
- Supply chain disruptions caused a 15% spike in module procurement costs.
- Grid interconnection requirements were more stringent than initially modeled.
- Labor shortages in the remote project location increased installation timelines.
Outcome: Strategic Mitigation and Financial Recovery
- Implemented a modular racking system to adapt to varying soil conditions.
- Renegotiated PPA terms to account for inflationary pressures on equipment.
- Optimized inverter placement to reduce total cabling length by 12%.
- Achieved a 5% improvement in annual energy yield through advanced cleaning schedules.
The recommendation for future projects is to incorporate a 10-15% contingency buffer specifically for site-specific civil works and to maintain a diversified supplier list to mitigate procurement risks. Rigorous upfront site analysis remains the most effective defense against the volatility of solar project economics.
Frequently Asked Engineering Questions
How does degradation impact long-term LCOE?
- Standard degradation rates typically range from 0.5% to 0.8% per year.
- Higher degradation forces a higher LCOE because the total lifetime energy production is lower.
- Engineers must use manufacturer-warranted degradation curves to ensure financial models remain bankable.
What is the role of the discount rate in LCOE?
- A higher discount rate increases the LCOE, as future energy revenues are worth less in today’s dollars.
- It reflects the cost of capital, including debt interest and equity return expectations.
- Sensitivity analysis on the discount rate is essential for understanding project risk under varying economic conditions.
Why is O&M cost estimation often underestimated?
- Inverter failure rates tend to increase significantly after year 10 of operation.
- Cleaning costs are often underestimated in arid or dusty environments where frequent maintenance is required.
- Labor costs for specialized technicians often rise faster than general inflation rates.
How do tax incentives affect project economics?
- These incentives improve the project’s IRR, making it more attractive to equity investors.
- They must be factored into the financial model at the correct timing to accurately reflect cash flow benefits.
- Regulatory changes to these incentives can pose a significant risk to the project’s financial viability.
What is the impact of grid curtailment on revenue?
- Curtailment risk is higher in regions with high renewable penetration and limited transmission capacity.
- Financial models should include a curtailment factor based on historical grid data to avoid overestimating revenue.
- Energy storage integration is a common strategy to mitigate the economic impact of curtailment.
How does site location influence CAPEX?
- Remote sites require significant investment in access roads and grid infrastructure.
- Topography dictates the complexity of racking systems and foundation designs.
- Local labor availability and wage rates can vary significantly, impacting the total installation cost.
Complete Course on
Piping Engineering
Check Now
Key Features
- 125+ Hours Content
- 500+ Recorded Lectures
- 20+ Years Exp.
- Lifetime Access
Coverage
- Codes & Standards
- Layouts & Design
- Material Eng.
- Stress Analysis

📚 Recommended Resources: Solar Power Plant Economics
Read these Guides
- 📄 Levelized Cost of Hydrogen: Engineering Economics for Industrial Decarbonization
- 📄 Green Ammonia Economics: A Technical Guide to Industrial Scale Profitability
- 📄 Green Methanol Production Economics: India Strategy & Cost Analysis 2026
- 📄 Renewable Electricity Procurement for RFNBO Hydrogen Projects