What is Response Spectrum and Steps for Earthquake Response Spectrum Analysis
In my 20 years of designing heavy industrial piping systems and structural supports, I have seen many engineers struggle with dynamic seismic design. Static lateral force procedures are simple, but they fall short when dealing with tall, irregular, or highly flexible structures. When ground motion strikes, a structure does not move as a single rigid block. It vibrates in complex, overlapping patterns.
To design safe, cost-effective structures in high-seismic zones, you must master the earthquake response spectrum analysis. This method bridges the gap between simple static calculations and highly complex, computationally expensive non-linear time history simulations. It gives us a reliable, code-compliant way to find peak displacements, shear forces, and bending moments.
What You Will Learn in This Guide
- The fundamental physics behind single-degree-of-freedom (SDOF) systems and response curves.
- A clear, step-by-step workflow to execute a multi-modal response spectrum analysis.
- How to select and apply modal combination rules like SRSS and CQC.
- Practical verification steps to ensure your finite element models comply with structural codes.
Complete Course on
Piping Engineering
Check Now
Key Features
- 125+ Hours Content
- 500+ Recorded Lectures
- 20+ Years Exp.
- Lifetime Access
Coverage
- Codes & Standards
- Layouts & Design
- Material Eng.
- Stress Analysis
What is a Seismic Response Spectrum?
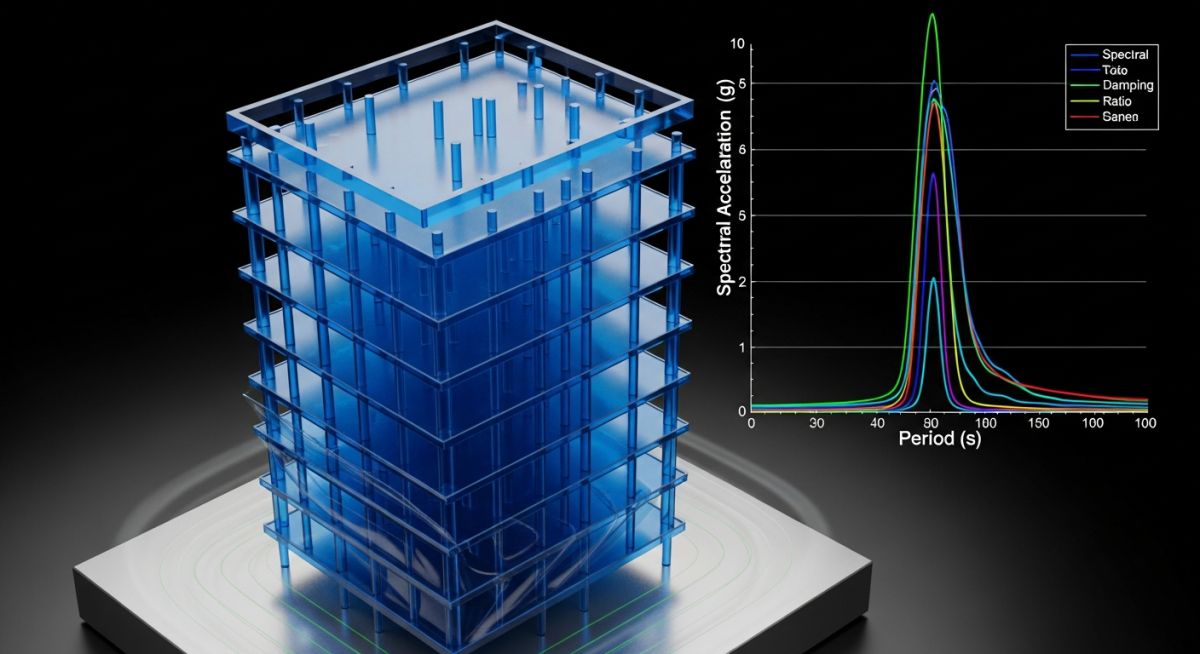
Response spectrum: A response spectrum is a graphical plot of the maximum response (displacement, velocity, or acceleration) of a series of single-degree-of-freedom (SDOF) oscillators with varying natural periods subjected to a specific transient ground motion.
To understand this concept, imagine a shake table with ten different vertical cantilevers fixed to it. Each cantilever has a mass at the top, but their heights and stiffnesses vary. This means each oscillator has a unique natural period of vibration (T). When we subject the shake table to a real earthquake accelerogram, each oscillator vibrates differently. Some will sway violently; others will barely move.
If we record the absolute maximum acceleration experienced by each oscillator during the entire earthquake and plot these peak values against their respective natural periods, we get an acceleration response spectrum. This curve is the foundation of modern earthquake engineering.
The Mathematical Formulation
The dynamic behavior of a damped SDOF system subjected to ground acceleration is governed by the classical equation of motion:
Where:
• m = mass of the system
• c = damping coefficient
• k = structural stiffness
• u(t) = relative displacement of the mass
• ug”(t) = ground acceleration history
By dividing the entire equation by the mass (m), we rewrite it in terms of the damping ratio (ζ) and the natural circular frequency (ω):
For any given damping ratio (typically 5% for reinforced concrete and welded steel structures), we solve this differential equation using Duhamel’s integral. The maximum relative displacement response is denoted as D. The spectral pseudo-acceleration (Sa) is then calculated using the relationship:
Steps for Earthquake Response Spectrum Analysis
Earthquake response spectrum analysis steps: The steps for earthquake response spectrum analysis involve building a multi-degree-of-freedom mathematical model, solving the eigenvalue problem to find natural frequencies and mode shapes, calculating modal participation factors, extracting spectral accelerations, and combining the modal responses using statistical methods.
When performing this analysis in modern finite element software, you must follow a strict sequence of engineering steps to ensure the results are physically meaningful and code-compliant.
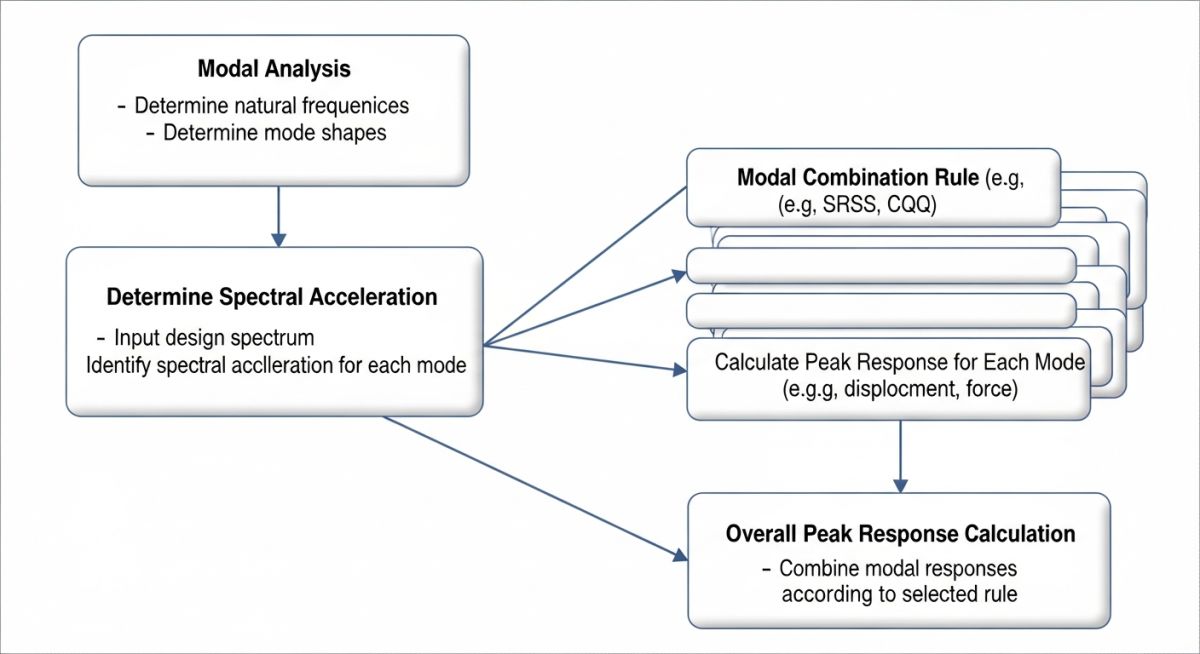
- Mathematical Modeling: Build a three-dimensional finite element model of the structure. You must accurately represent the spatial distribution of both mass and stiffness. Ensure that you include all dead loads and an appropriate portion of live loads in the seismic mass source definition.
- Eigenvalue Analysis: Solve the undamped free-vibration eigenvalue problem to determine the natural frequencies (ω_i) and corresponding mode shapes (φ_i) of the structure.
- Modal Participation Factors: Calculate the modal participation factor (Γ_i) for each mode. This factor measures how strongly a specific mode is excited by ground motion in a given direction.
- Spectral Acceleration Extraction: For each mode’s calculated natural period (T_i), look up the corresponding spectral acceleration (Sa_i) from your design response spectrum curve.
- Modal Response Calculation: Compute the peak displacement, drift, and internal forces for each individual mode. These are isolated, uncoupled responses.
- Modal Combination: Because the peak responses of different modes do not occur at the exact same instant during an earthquake, you cannot simply add them together. You must use statistical combination methods like Square Root of the Sum of the Squares (SRSS) or Complete Quadratic Combination (CQC) to find the total design values.
In my field reviews, I often see engineers use the simple SRSS combination method for structures with complex geometries or asymmetric layouts. If your structure has natural frequencies that are within 10% of each other, SRSS will yield highly inaccurate, unsafe results because it ignores modal coupling. Under ASCE 7 guidelines, you must use the Complete Quadratic Combination (CQC) method in these scenarios to account for cross-modal correlation.
Standard Parameters for Seismic Design Spectra
Seismic design parameters: Seismic design parameters establish the boundary conditions for constructing design response spectra based on site soil classification and mapped spectral acceleration parameters.
To construct a design response spectrum according to the International Building Code (IBC), you must identify the site class and determine the mapped spectral acceleration parameters for short periods (Ss) and 1-second periods (S1). The table below outlines how site soil conditions alter these design parameters.
| Site Class | Soil Profile Name | Shear Wave Velocity, Vs (m/s) | Standard Penetration, N | Seismic Amplification Behavior |
|---|---|---|---|---|
| A | Hard Rock | > 1,500 | N/A | Minimal amplification; high frequency transmission |
| B | Rock | 760 to 1,500 | N/A | Standard reference spectrum baseline |
| C | Very Dense Soil and Soft Rock | 360 to 760 | > 50 | Moderate amplification of short-period waves |
| D | Stiff Soil (Default Class) | 180 to 360 | 15 to 50 | Significant amplification; standard design default |
| E | Soft Clay Soil | < 180 | < 15 | High amplification; prone to resonance issues |
To help you navigate the complex terminology used in structural dynamics and finite element analysis software, I have compiled this comprehensive entity mapping matrix.
| Technical Entity | Acronym | Physical Parameter | Governing Code / Reference |
|---|---|---|---|
| Single-Degree-of-Freedom | SDOF | Mass, Stiffness, Damping Ratio (ζ) | Chopra’s Dynamics of Structures |
| Multi-Degree-of-Freedom | MDOF | Mass Matrix [M], Stiffness Matrix [K] | ASCE 7 Chapter 12 |
| Complete Quadratic Combination | CQC | Cross-modal correlation coefficient (ρ_ij) | FEMA P-1051 Design Guide |
| Square Root of Sum of Squares | SRSS | Pure statistical independent summation | ASCE 4-16 Standard |
| Modal Mass Participation | MMPF | Percentage of total dynamic mass (> 90%) | IBC Section 1613 |
How to Verify Response Spectrum Models?
Model verification: Model verification ensures that the mathematical representation of the structure captures at least 90 percent of the dynamic mass and complies with structural code limits.
Before you accept the output of any finite element analysis software, you must perform a series of sanity checks. Blindly trusting software outputs is one of the most common mistakes I see junior engineers make. Use this checklist to verify your dynamic models.
Step-by-Step Model Verification Checklist
-
Verify Mass Source Definition: Ensure that the dynamic mass includes 100% of the dead load, structural self-weight, and at least 25% of the design live load for storage areas, plus any permanent equipment operating weights.
-
Check Modal Mass Participation: Confirm that the cumulative modal mass participation factor is at least 90% in all horizontal directions of interest. If it is lower, you must increase the number of calculated modes in your solver settings.
-
Inspect First Mode Shape: Visually inspect the first three mode shapes. The first mode should represent pure translational behavior in the primary weak axis. If the first mode is torsional, your structure lacks torsional stiffness and needs structural layout adjustments.
-
Apply Base Shear Scaling: Compare the dynamic base shear (V_dynamic) with the equivalent lateral force static base shear (V_static). If the dynamic base shear is less than 100% of the static base shear, you must scale up all dynamic forces by the ratio (V_static / V_dynamic) as required by ASCE 7.
-
Validate Diaphragm Behavior: Check if your floor slabs are modeled as rigid or semi-rigid diaphragms. Ensure that the diaphragm assumptions match the actual physical stiffness of your floor system.
Field Case Study: Real-World Application
A 15-meter-tall multi-tier industrial pipe rack in a high-seismic zone (Category E) suffered from excessive lateral displacement and torsional twisting during preliminary equivalent lateral force (ELF) analysis. The design team failed to account for the dynamic coupling of heavy process lines, leading to over-designed structural steel members that exceeded the foundation load capacity.
I led the transition to a rigorous multi-modal response spectrum analysis using CQC modal combination. By accurately modeling the dynamic mass of the piping systems and applying the design spectrum from ASCE 7-16, we identified that the first three modes were highly coupled. Implementing targeted diagonal bracing at critical nodes reduced the lateral drift by 42% and optimized the steel weight by 18 tons, saving the client over 120,000 while fully satisfying seismic safety codes.
Frequently Asked Engineering Questions
What is the difference between response spectrum and time history analysis?
Why is 90% mass participation required in seismic codes?
When should I use CQC instead of SRSS modal combination?
How does soil-structure interaction affect the response spectrum?
What is the significance of the response modification coefficient (R)?
Can response spectrum analysis capture non-linear structural behavior?