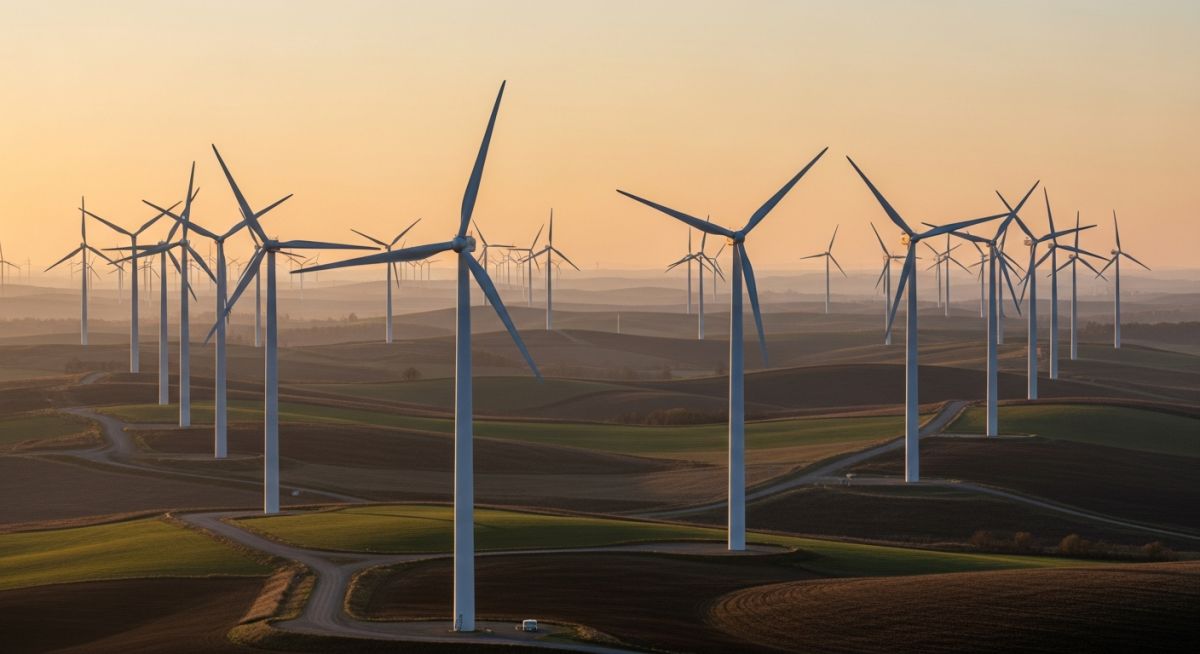
Wind Power Plant Economics and LCOE Introduction
In my two decades of experience managing industrial infrastructure, I have observed that the financial viability of a wind project is rarely determined by the turbine technology alone. Instead, it hinges on the rigorous integration of site-specific wind power plant economics into the early-stage design phase. Whether you are evaluating offshore foundations or onshore grid integration, understanding the interplay between CAPEX, OPEX, and the capacity factor is the difference between a bankable project and a stranded asset.
This guide dissects the financial architecture of wind energy, moving beyond simple cost estimates to explore the sensitivity of LCOE to technical variables. We will examine how engineering decisions—such as material selection for towers or maintenance strategies for gearboxes—directly impact the long-term revenue models of your facility.
Key Takeaways for Project Engineers:
- Mastering the LCOE formula to account for discount rates and project lifespans.
- Identifying the primary CAPEX drivers in balance-of-plant (BOP) infrastructure.
- Optimizing OPEX through predictive maintenance and remote monitoring protocols.
- Analyzing how capacity factor fluctuations dictate revenue stability in volatile markets.
Technical Deep-Dive: Wind Power Plant Economics
Wind Power Plant Economics: The analytical framework used to quantify the total lifecycle costs of wind energy generation, normalized against expected energy output to facilitate investment decision-making.
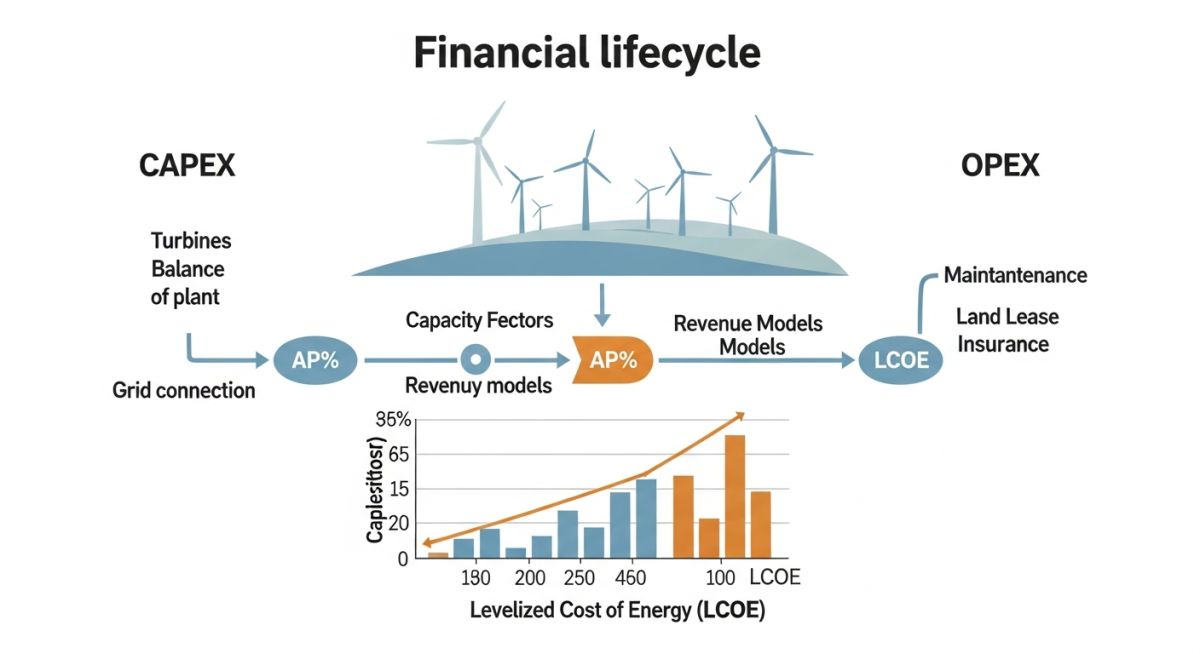
To calculate the LCOE, we must aggregate all costs over the project lifetime and divide by the total energy produced, adjusted for the time value of money. The fundamental equation involves the sum of annual costs divided by the sum of annual energy production, both discounted to the present value. In my experience, the most common error in financial modeling is underestimating the “Balance of Plant” (BOP) costs, which often account for 25-30% of total CAPEX.
CAPEX components include turbine procurement, foundation engineering (often governed by ASCE standards for structural integrity), electrical collection systems, and grid interconnection. When calculating these, we must account for the “learning curve” effect, where costs decrease as cumulative capacity increases. However, site-specific geotechnical challenges often offset these gains, requiring robust contingency planning in your API-compliant risk assessments.
Field Warning: The Capacity Factor Trap
Do not rely on theoretical maximums for capacity factor calculations. Real-world performance is heavily degraded by wake effects, curtailment, and mechanical downtime. Always apply a site-specific “P50” and “P90” probability analysis to your energy yield assessments to avoid overestimating revenue.
OPEX is equally critical, split between fixed costs (land lease, insurance, administrative) and variable costs (scheduled maintenance, component replacement, lubrication). Predictive maintenance, utilizing vibration analysis and oil debris monitoring, has become the industry standard for reducing unplanned downtime. By shifting from reactive to proactive maintenance, operators can often reduce OPEX by 15% over a 20-year project lifespan.
Finally, sensitivity analysis must be performed on the discount rate and the capacity factor. A 1% change in the discount rate can shift the LCOE by as much as 5-8%, depending on the debt-to-equity ratio. Engineers must collaborate with financial analysts to ensure that the technical assumptions—such as turbine availability and degradation rates—are reflected accurately in the sensitivity matrix.
Economic Performance Evaluation: A comparative assessment of the financial benefits and structural risks inherent in utility-scale wind energy deployment.
Advantages
- Zero fuel cost volatility eliminates long-term commodity price risk.
- Modular scalability allows for phased investment and capacity expansion.
- Rapid deployment timelines compared to nuclear or large-scale hydro.
- Strong government subsidies and tax credit frameworks (e.g., PTC/ITC).
- Low environmental footprint during the operational phase.
Disadvantages
- High initial capital intensity for turbine and foundation logistics.
- Intermittency requires expensive grid-level storage or backup capacity.
- Geographic constraints limit site selection to high-wind corridors.
- Significant decommissioning costs at the end of the asset life.
- Complex supply chain dependencies for rare earth magnets and composites.
Renewable Energy Integration: The practical deployment of wind power systems across diverse industrial and utility sectors to optimize energy cost structures.
Utility-Scale Grid Decarbonization
Large-scale wind farms are integrated directly into the high-voltage transmission network to replace coal or gas-fired baseload generation. This application focuses on maximizing the capacity factor through advanced turbine spacing and wake-steering control algorithms to ensure grid stability.
Industrial Feedstock Decarbonization
Energy-intensive industries, such as green hydrogen production or aluminum smelting, utilize dedicated wind power plants to secure low-cost, carbon-free electricity. By co-locating the wind farm with the industrial facility, operators minimize transmission losses and hedge against fluctuating retail electricity prices.
Offshore Wind Infrastructure Development
Offshore wind projects leverage higher, more consistent wind speeds to achieve superior capacity factors compared to onshore sites. This application requires specialized marine engineering, including monopile or jacket foundation design, to withstand harsh corrosive environments and deep-water hydrostatic pressures.
Financial modeling for wind energy projects requires a granular understanding of cost distribution across the project lifecycle. In my experience, the initial capital expenditure (CAPEX) is dominated by turbine procurement and balance of plant (BoP) infrastructure, while operational expenditure (OPEX) is heavily influenced by site accessibility and maintenance strategies. The following table provides a standardized breakdown of these cost drivers, aligned with NREL and IRENA reporting standards for utility-scale onshore wind farms.
When evaluating these figures, remember that regional variations in labor costs, grid connection distances, and local permitting requirements can shift these percentages significantly. I always advise project developers to apply a contingency factor of at least 10-15% on the total CAPEX to account for unforeseen geotechnical conditions or supply chain volatility during the construction phase.
| Cost Category | Typical % of Total | Primary Drivers |
|---|---|---|
| Turbine Procurement | 60% – 70% | Rotor diameter, hub height, rating |
| Balance of Plant (BoP) | 15% – 20% | Civil works, electrical grid connection |
| Soft Costs | 5% – 10% | Permitting, land lease, legal fees |
| Annual OPEX | 2% – 4% of CAPEX | O&M contracts, insurance, site taxes |
To effectively manage the financial health of a wind power plant, engineers must map technical performance metrics directly to economic outcomes. This matrix correlates key physical parameters with their corresponding financial impact, ensuring that design decisions—such as selecting a higher capacity factor turbine—are justified by the resulting reduction in the Levelized Cost of Energy (LCOE). By aligning these entities, we bridge the gap between mechanical engineering specifications and project finance requirements.
The following matrix serves as a reference for project managers to identify which technical variables have the highest sensitivity to revenue fluctuations. For instance, while increasing hub height improves the capacity factor, it also increases the structural steel requirements and crane mobilization costs, creating a non-linear relationship that must be modeled carefully in the project’s financial feasibility study.
| Entity | Technical Metric | Financial Impact |
|---|---|---|
| Capacity Factor | Actual vs Theoretical Output | Direct Revenue Multiplier |
| Availability | Uptime Percentage | OPEX Efficiency / Revenue Loss |
| LCOE | Total Cost / Total Energy | Project Competitiveness |
| PPA | Power Purchase Agreement | Revenue Certainty |
Wind Power Plant Economics: Successful project execution relies on rigorous site verification to ensure that the projected capacity factor aligns with actual wind resource availability. Before finalizing any financial model, I mandate a comprehensive site audit to validate the assumptions used in the LCOE calculation. This process minimizes the risk of revenue shortfalls caused by inaccurate wind speed modeling or unforeseen site constraints.
Pre-Construction Verification Checkpoints
- ✓ Wind Resource Assessment: Verify at least 24 months of on-site anemometry data to confirm the P50 and P90 energy yield estimates.
- ✓ Geotechnical Survey: Confirm soil bearing capacity for turbine foundations to avoid costly redesigns of the Balance of Plant (BoP) infrastructure.
- ✓ Grid Connection Feasibility: Validate the distance to the nearest substation and confirm the capacity of the local grid to absorb the projected power output.
- ✓ Logistics and Access: Assess road width and turning radii to ensure heavy-lift cranes and turbine components can reach the site without expensive infrastructure upgrades.
- ✓ Permitting Compliance: Ensure all environmental impact assessments (EIA) are completed and local zoning laws are satisfied to prevent project delays.
By systematically addressing these checkpoints, you reduce the “risk premium” often applied by lenders, which directly lowers the cost of debt and improves the overall project IRR. Always document these findings in a formal site feasibility report, as this document will be the primary reference for project financiers and stakeholders during the investment committee review process.
Problem: Unexpected Capacity Factor Degradation
A 100MW wind farm in a high-turbulence region experienced a 15% drop in expected annual energy production (AEP) during its second year of operation.
- Inaccurate wake effect modeling during the initial design phase.
- Higher-than-anticipated blade erosion due to local particulate matter.
- Suboptimal turbine control settings failing to account for extreme wind shear.
- Delayed maintenance response times due to poor site access during winter months.
Outcome: Financial Recovery and Optimization
By implementing a targeted remediation strategy, the project recovered 12% of the lost AEP within 18 months.
- Retrofitting blades with leading-edge protection (LEP) to reduce erosion.
- Updating the SCADA control software to optimize pitch angles for high-shear conditions.
- Establishing a local spare parts depot to reduce mean time to repair (MTTR).
- Renegotiating the O&M contract to include performance-based availability bonuses.
My recommendation for similar projects is to prioritize “availability-focused” maintenance contracts from the outset. While these may carry a higher upfront cost, the reduction in downtime and the protection of the revenue stream significantly improve the long-term LCOE compared to standard reactive maintenance models.
How does the capacity factor influence LCOE?
- Higher capacity factors are achieved through better site selection and taller hub heights.
- Increased output directly offsets the fixed annual debt service and operational costs.
- Engineers must balance the cost of larger rotors against the marginal gain in capacity factor.
What are the main components of wind CAPEX?
- Turbine procurement typically accounts for 65% of total capital costs.
- Civil works include foundation design, access roads, and crane pads.
- Electrical infrastructure covers transformers, cabling, and substation upgrades.
- Soft costs include environmental permitting, land acquisition, and project management fees.
How is OPEX managed in modern wind farms?
- Predictive analytics reduce the frequency of manual site inspections.
- Long-term service agreements (LTSA) provide cost certainty for major component replacements.
- Remote monitoring centers allow for centralized control of multiple wind farm clusters.
What is the role of the PPA in revenue?
- PPAs provide revenue certainty for 15 to 25 years.
- They allow developers to hedge against fluctuating wholesale electricity prices.
- Creditworthiness of the off-taker is a critical factor in the project’s risk profile.
How do sensitivity analyses impact design?
- Identifies “tipping points” where a project becomes financially unviable.
- Guides investment in risk-mitigation strategies, such as better wind resource data.
- Informs the selection of turbine technology based on site-specific conditions.
What are the primary cost reduction drivers?
- Larger rotor diameters capture more energy at lower wind speeds.
- Standardization of components reduces manufacturing and logistics costs.
- Improved digital tools for site planning and resource assessment reduce development time.
Complete Course on
Piping Engineering
Check Now
Key Features
- 125+ Hours Content
- 500+ Recorded Lectures
- 20+ Years Exp.
- Lifetime Access
Coverage
- Codes & Standards
- Layouts & Design
- Material Eng.
- Stress Analysis

📚 Recommended Resources: Wind Power Plant Economics
Read these Guides
- 📄 Levelized Cost of Hydrogen: Engineering Economics for Industrial Decarbonization
- 📄 Green Ammonia Economics: A Technical Guide to Industrial Scale Profitability
- 📄 Refinery vs Petrochemical Plant: 2026 Integration & Differences Guide
- 📄 Green Methanol Production Economics: India Strategy & Cost Analysis 2026