
Wind Farm Layout and Micro-Siting: Maximizing Energy Yield
In my two decades of engineering experience, I have learned that the difference between a profitable wind project and a stranded asset often comes down to the initial layout design. Micro-siting is not merely about placing turbines on a map; it is a complex optimization problem involving fluid dynamics, terrain topography, and long-term meteorological data.
When we talk about wind farm layout and micro-siting, we are balancing the competing interests of land availability, grid connection costs, and the inevitable wake effect. If you ignore the micro-scale variations in wind shear or turbulence intensity, you risk significant fatigue loading on your turbine components and a permanent reduction in your project’s capacity factor.
Key Takeaways for Engineers
- Prioritize wake loss mitigation through staggered row configurations.
- Integrate high-resolution LiDAR data to validate site-specific wind shear.
- Account for terrain-induced turbulence that exceeds standard IEC 61400-1 requirements.
- Balance electrical collection system costs against optimal aerodynamic spacing.
Wind Farm Layout and Micro-Siting Fundamentals
Wind Farm Layout and Micro-Siting: The technical discipline of optimizing turbine coordinates to mitigate wake-induced velocity deficits and turbulence-driven structural fatigue, governed by IEC 61400 standards.
The primary objective in any layout design is to minimize the wake effect, where a downstream turbine operates in the reduced-velocity, high-turbulence flow of an upstream unit. In my experience, the wake recovery process is non-linear and highly dependent on the ambient turbulence intensity (TI). As wind passes through the rotor, kinetic energy is extracted, creating a velocity deficit that recovers as ambient air mixes into the wake.
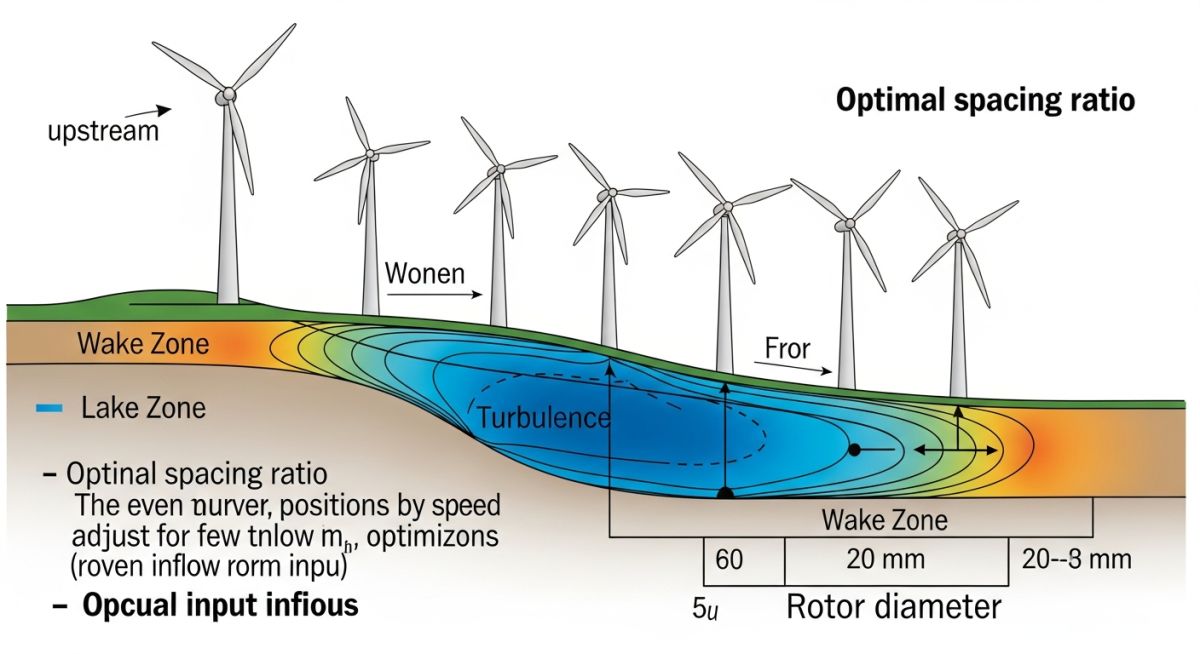
Calculating Wake Deficit and Spacing
To calculate the velocity deficit, we often utilize the Jensen or Ainslie models. The Jensen model assumes a linear expansion of the wake diameter (D_w) based on a wake decay constant (k). The formula for the wake radius at a distance (x) is defined as:
D_w = D_0 + 2 * k * x
Where D_0 is the rotor diameter and k is typically 0.075 for onshore sites. If the downstream turbine is located within this radius, the effective wind speed (V_eff) is reduced, directly impacting power output, which scales with the cube of the wind speed (P = 0.5 * rho * A * Cp * V^3). Even a 5% reduction in wind speed can lead to a 15% drop in power production.
Field Warning: Turbulence Intensity (TI)
Standard layouts often fail to account for site-specific TI. If your micro-siting ignores terrain-induced turbulence, you may exceed the design load limits specified in IEC 61400-1. Always perform a site-specific turbulence assessment if the terrain complexity index (TCI) exceeds 0.15.
Terrain Analysis and Shear
Terrain analysis is the bedrock of effective micro-siting. We use the power law or logarithmic wind profile to estimate wind shear. The power law exponent (alpha) varies significantly with surface roughness. In flat, open terrain, alpha is typically 0.14, but in complex or forested terrain, it can exceed 0.30.
When placing turbines, I always look for “speed-up” effects on ridges or hilltops. However, these locations also introduce flow separation and increased turbulence. The goal is to find the “sweet spot” where the increase in mean wind speed outweighs the negative impact of increased turbulence on the turbine’s structural integrity.
Micro-Siting Optimization Trade-offs: The strategic evaluation of turbine placement to balance maximum energy capture against long-term structural reliability and operational maintenance costs.
Advantages
- Significant increase in Annual Energy Production (AEP) through wake loss reduction.
- Extended component life by avoiding high-turbulence zones.
- Optimized electrical cabling routes reducing total project CAPEX.
- Improved compliance with environmental noise and shadow flicker regulations.
Disadvantages
- Increased initial engineering and site survey costs.
- Potential for longer permitting timelines due to specific site constraints.
- Complexity in managing logistics for non-uniform turbine placement.
- Risk of underestimating site-specific turbulence if data is insufficient.
Wind Farm Micro-Siting Applications: The deployment of advanced layout optimization techniques across diverse geographical and industrial sectors to ensure project viability and grid stability.
Complex Terrain Wind Projects
In mountainous regions, micro-siting is critical to avoid flow separation zones that cause severe blade fatigue. Engineers utilize CFD (Computational Fluid Dynamics) modeling to map flow vectors, ensuring turbines are placed on stable, high-velocity ridges while avoiding turbulent lee-side pockets.
Offshore Wind Farm Arrays
Offshore environments require massive spacing to manage the wake effect, as the low surface roughness allows wakes to persist for several kilometers. Micro-siting here focuses on maximizing the “array efficiency” by staggering rows relative to the dominant wind rose, often utilizing large-scale wake steering techniques.
Repowering Existing Wind Assets
When replacing older, smaller turbines with modern, larger units, micro-siting is constrained by existing foundations and grid infrastructure. The challenge is to optimize the new, larger rotor diameters within the legacy footprint while minimizing the impact of the new, more powerful wakes on neighboring units.
Optimizing a wind farm layout requires a rigorous evaluation of aerodynamic interactions and site-specific environmental constraints. In my experience, the primary objective is to balance the reduction of wake-induced turbulence with the maximization of land utilization efficiency. The following table outlines the critical design parameters that dictate turbine placement, focusing on the relationship between rotor diameter and spacing requirements to ensure structural longevity and optimal power output.
These parameters are governed by IEC 61400-1 standards, which define the design requirements for wind turbines. Engineers must account for the prevailing wind direction, site turbulence intensity, and the specific power curve of the selected turbine model. Failure to adhere to these spacing guidelines often results in accelerated fatigue loading on downstream components, significantly reducing the operational lifespan of the asset.
| Parameter | Typical Range | Engineering Impact |
|---|---|---|
| Cross-wind Spacing | 3D to 5D | Minimizes lateral wake interference |
| Down-wind Spacing | 7D to 10D | Allows for wake recovery and mixing |
| Turbulence Intensity | 6% to 15% | Dictates fatigue load calculations |
| Rotor Diameter (D) | 100m to 250m | Primary scaling factor for spacing |
The complexity of modern wind farm layout and micro-siting necessitates a structured approach to data integration. By mapping physical site characteristics against aerodynamic models, engineers can predict energy yield with higher precision. This matrix serves as a reference for the core entities involved in the design process, linking physical phenomena to the relevant industry standards and analytical methodologies used in the field.
Effective micro-siting is not merely about placing turbines in high-wind areas; it is about understanding the interaction between the atmospheric boundary layer and the turbine array. The entities listed below represent the fundamental building blocks of a comprehensive site assessment. Utilizing these in conjunction with computational fluid dynamics (CFD) software allows for the iterative refinement of the layout, ensuring that the final configuration meets both economic and technical performance targets.
| Entity | Standard/Reference | Primary Function |
|---|---|---|
| Wake Model | NREL/FAST | Predicts velocity deficit behind rotors |
| Wind Resource Map | IEC 61400-12 | Spatial distribution of wind speed |
| Terrain Roughness | WAsP Methodology | Adjusts wind profiles for surface friction |
| Fatigue Load | IEC 61400-3 | Structural integrity assessment |
Before finalizing any wind farm layout and micro-siting strategy, a comprehensive site verification process is mandatory. This ensures that the theoretical models align with the physical realities of the terrain, soil conditions, and environmental constraints. In my experience, skipping these verification steps often leads to costly mid-construction adjustments or long-term operational inefficiencies.
-
1.
Geotechnical Assessment: Verify soil bearing capacity at every proposed turbine location to ensure foundation stability according to ASCE standards. -
2.
Wake Effect Validation: Confirm that the chosen spacing accounts for the specific turbulence intensity of the site, preventing excessive downstream fatigue. -
3.
Environmental Compliance: Check for noise emission limits and shadow flicker impacts on nearby residential zones as per local regulatory requirements. -
4.
Grid Connection Path: Ensure the layout allows for efficient cable routing and substation placement to minimize electrical losses. -
5.
Access Road Feasibility: Validate that heavy-lift cranes can navigate the terrain to reach each turbine pad without exceeding slope limitations.
Each checkpoint must be documented and signed off by the lead civil and electrical engineers. This verification phase acts as the final gate before procurement and mobilization, providing the necessary confidence that the micro-siting design is both constructible and bankable.
The Challenge: Unexpected Wake Interference
A 200MW wind farm project in a complex hilly terrain faced significant underperformance in the second year of operation due to unforeseen wake interactions.
- Initial micro-siting failed to account for seasonal wind direction shifts.
- Turbine spacing was optimized for a flat-terrain model, ignoring local orographic effects.
- Downstream turbines experienced 15% higher turbulence than predicted.
- Increased gearbox failure rates were observed in the second row of the array.
The Outcome: Optimized Re-Siting
By implementing a dynamic wake-steering strategy and re-evaluating the micro-siting based on high-resolution LiDAR data, the project recovered significant energy yield.
- Energy yield increased by 4.2% through strategic yaw adjustments.
- Fatigue load monitoring systems were installed to manage downstream stress.
- Future layout iterations now utilize 3D CFD modeling for all complex terrain sites.
- Operational availability improved by 8% following the corrective measures.
My recommendation for similar projects is to prioritize high-fidelity wind resource assessment over simplified analytical models. Always integrate real-time operational data into the micro-siting feedback loop to ensure long-term asset performance.
Frequently Asked Engineering Questions
How does terrain roughness impact micro-siting?
- Higher roughness values, such as forests or urban areas, increase turbulence and reduce wind speed at lower altitudes.
- Engineers use the roughness length parameter to adjust wind speed data from meteorological masts to the turbine hub height.
- Accurate mapping of these features is essential for minimizing the wake effect, as rougher terrain can lead to faster wake recovery but higher ambient turbulence.
- Failure to account for surface friction often leads to an overestimation of the annual energy production (AEP).
What is the role of wake steering in layout design?
- This technique reduces the velocity deficit experienced by downstream turbines, thereby increasing the total farm-wide energy yield.
- It requires sophisticated control algorithms and real-time wind sensing to be effective across varying wind conditions.
- While it increases the fatigue load on the steering turbine, the net gain in power production often justifies the trade-off.
- Modern IEA research indicates that wake steering is becoming a standard feature in large-scale offshore wind farm layouts.
Why is turbulence intensity a critical design constraint?
- High turbulence levels cause rapid fluctuations in aerodynamic loading, leading to accelerated material degradation.
- Designers must select turbine classes that are certified for the specific turbulence intensity of the site as defined in IEC 61400-1.
- In micro-siting, turbines should be placed to avoid areas where wake-induced turbulence from upstream units exceeds the turbine’s design limit.
- Effective layout design balances the need for high wind speeds with the necessity of maintaining low turbulence levels for structural longevity.
How do I calculate the optimal turbine spacing?
- Start by defining the rotor diameter (D) and applying standard spacing rules of 5D to 10D as a baseline.
- Use wake modeling software to simulate the velocity deficit and turbulence intensity for various array configurations.
- Incorporate the site’s wind rose data to ensure that the spacing is optimized for the most frequent and high-energy wind directions.
- Perform a cost-benefit analysis to determine if the marginal increase in energy yield from wider spacing outweighs the additional costs of cabling and road construction.
What are the limitations of current layout tools?
- Many tools struggle with highly complex terrain where flow separation and recirculation zones are prevalent.
- Computational fluid dynamics (CFD) models are more accurate but require significant processing time and expertise to implement correctly.
- There is often a gap between the idealized model output and the actual performance observed during the operational phase.
- Engineers must supplement tool outputs with field measurements and expert judgment to ensure the design is robust and reliable.
How does micro-siting affect grid integration?
- Optimizing turbine locations to minimize cable lengths can significantly reduce electrical losses and capital expenditure.
- The layout must also consider the accessibility of the substation and the capacity of the local grid to handle the power output.
- Strategic placement can help in balancing the power output profile, reducing the volatility of the energy injected into the grid.
- Close coordination between the wind farm layout team and the electrical engineering team is essential for a successful project.
Complete Course on
Piping Engineering
Check Now
Key Features
- 125+ Hours Content
- 500+ Recorded Lectures
- 20+ Years Exp.
- Lifetime Access
Coverage
- Codes & Standards
- Layouts & Design
- Material Eng.
- Stress Analysis