What is Process Flow Diagram (PFD)? Purpose, Symbols, Examples, & Development of 2026

Imagine walking into a multi-billion dollar petrochemical facility where a critical pump has just tripped. The alarm logs show a pressure surge, but the site layout is a maze of steel. Without a clear “GPS” for the molecules, your troubleshooting is blind.
The Process Flow Diagram (PFD) is that GPS. It strips away the mechanical clutter of valves and supports to reveal the thermodynamic heartbeat of your plant. In this guide, we dive deep into how a well-constructed PFD serves as the foundational document for mass balances, energy optimization, and safe engineering design.
Key Takeaways
- The Foundation: Understand why the PFD is the primary document for Heat and Material Balance (HMB) data.
- Standardization: Learn the critical difference between ISO 10628 and local tagging conventions.
- Operational Logic: Discover how PFDs bridge the gap between initial conceptual design and detailed P&ID development.
What is a Process Flow Diagram (PFD)?
A Process Flow Diagram (PFD) is a specialized schematic used in chemical and process engineering to illustrate the general flow of plant processes and equipment. It highlights the relationship between major components, showing process stream ratings, fluid compositions, and operating conditions like temperature and pressure.
“In my 20 years of plant commissioning, the biggest mistakes I’ve seen stem from engineers treating the PFD as just a drawing. It’s not a drawing; it’s a living simulation of your plant’s thermodynamics. If your mass balance is off on the PFD, your plant will never reach nameplate capacity.”
— Atul Singla
Table of Contents
Complete Course on
Piping Engineering
Check Now
Key Features
- 125+ Hours Content
- 500+ Recorded Lectures
- 20+ Years Exp.
- Lifetime Access
Coverage
- Codes & Standards
- Layouts & Design
- Material Eng.
- Stress Analysis
Engineering Mastery: PFD Proficiency Quiz
Test your knowledge on Process Flow Diagram standards and logic
Quiz Complete!
What is a Process Flow Diagram (PFD)?
A Process Flow Diagram (PFD) is a critical engineering schematic that provides a high-level overview of a chemical process or industrial facility. Unlike detailed mechanical drawings, the PFD focuses on the "topology" of the process—how raw materials are transformed into products through various unit operations. It serves as the primary communication tool between process engineers, project managers, and stakeholders during the conceptual and basic engineering phases.
In the hierarchy of engineering documents, the PFD sits directly below the Block Flow Diagram (BFD) and above the Piping and Instrumentation Diagram (P&ID). It defines the design intent by illustrating major equipment such as reactors, distillation columns, and heat exchangers, while omitting minor details like utility lines or pipe sizes that are not essential to the process chemistry.
The Core Purpose of a Process Flow Diagram (PFD)
The fundamental purpose of a PFD is to document the Heat and Material Balance (HMB). This ensures that the law of conservation of mass is respected across the entire plant. By studying a PFD, an engineer can instantly identify the flow rates, temperatures, and pressures at any given node in the system.
- Process Validation: Ensuring that the chemical reactions and physical separations are theoretically sound.
- Equipment Sizing: Providing the necessary data for mechanical engineers to specify the dimensions and metallurgy of vessels.
- Control Philosophy: Laying out the primary control loops (Level, Flow, Temperature, Pressure) required to keep the process stable.
- Safety Analysis: Serving as the baseline for early-stage Hazard and Operability (HAZOP) studies.
Step-by-Step Development of Process Flow Diagram (PFD)
Developing a PFD is a logical progression that begins with a simulation. Engineers typically use software like Aspen HYSYS or AVEVA Process Simulation to generate the thermodynamic data before a single line is drawn on a drafting board.
Define the Design Basis
Establishing the feed composition, required product purity, and environmental constraints. This stage often references the ISO 10628 standards for diagram consistency.
Identify Unit Operations
Determining which equipment is needed (e.g., flash drums, centrifugal pumps, or shell-and-tube heat exchangers) to achieve the desired transformation.
Map the Interconnections
Drawing the primary process lines. Remember: in a PFD, flow usually goes from left to right, with heavy components exiting the bottom and light components exiting the top of vessels.
Critical Information Contained in a Process Flow Diagram (PFD)
A professional PFD is more than just icons; it is a data-rich document. Every line and symbol represents a physical reality that must be accounted for in the project budget and safety plan.
Design Basis and Material Balance
The Material Balance is often provided as a "Stream Summary Table" at the bottom of the sheet. It includes mass flow, molar flow, and vapor fraction for every numbered stream flag.
Energy Balance and Physical Data
Thermal loads for heaters and coolers are specified (usually in MW or BTU/hr), allowing utilities like cooling water or steam to be sized accurately.
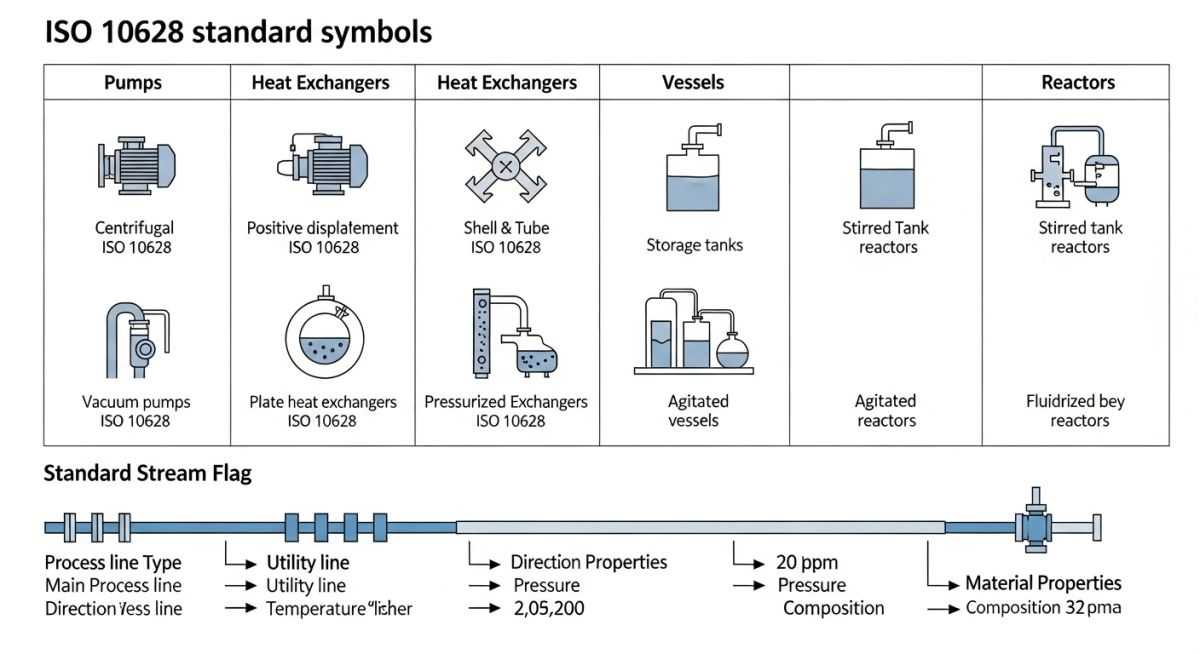
Standard Symbols for Process Flow Diagram (PFD)
Consistency in symbology is the bedrock of global engineering. To ensure a PFD created in Tokyo can be read in Houston, industry professionals adhere to ISO 10628 and ANSI/ISA-5.1. These standards define the geometry of equipment icons and the shorthand for process connections.
Stream Identification and Equipment Conventions
Every line on a PFD represents a process stream. These are identified by Stream Flags (diamond or rectangular callouts) containing a unique number. This number serves as the primary key for the Heat and Material Balance (HMB) table.
| Equipment Category | Common Tag Prefix | Standard Reference |
|---|---|---|
| Vessels / Columns | V / C | ASME Section VIII |
| Heat Exchangers | E / HX | TEMA Standards |
| Pumps / Compressors | P / K | API 610 / API 617 |
| Reactors | R | ISO 10628 |
PFD vs P&ID: Understanding the Key Differences
A common point of confusion for junior engineers is the distinction between a PFD and a Piping and Instrumentation Diagram (P&ID). While they share similar icons, their "intent" is vastly different. The PFD is a conceptual document, whereas the P&ID is a mechanical and construction document.
Included in PFD
- Major equipment names and IDs
- Process flow paths (Left to Right)
- Stream compositions & physical properties
- Operational pressure and temperature
- Major bypass and recirculation lines
Excluded (Reserved for P&ID)
- Detailed pipe sizes and schedules
- Isolation valves (Gate, Ball, Globe)
- Vents, drains, and sample points
- Electrical wiring and I/O signals
- Piping metallurgy and insulation specs
Codes and Standards for Process Flow Diagram (PFD) Design
To maintain regulatory compliance and safety, PFDs must be developed in accordance with recognized engineering practices. For instance, the relief valve sizing paths shown on a PFD often reference the American Petroleum Institute (API) Standards, specifically API 520 and 521.
Adherence to ASME codes ensures that the pressure and temperature ratings specified on the PFD are achievable within the mechanical limits of the materials chosen during the later design stages.
📊 PFD Stream Mass Balance Calculator
Use this interactive tool to calculate the Mass Flow Rate or Density of a process stream, a critical step in developing the Heat and Material Balance (HMB) for your Process Flow Diagram (PFD).
Formula: Mass Flow (ṁ) = Volumetric Flow (Q) × Density (ρ)
Real-World Case Study: PFD Optimization in a Crude Distillation Unit (CDU)
Scenario: Resolving Heat Integration Bottlenecks
In 2026, a major refinery in Southeast Asia faced a 15% energy cost spike due to inefficient heat recovery in their atmospheric distillation column. By performing a deep-dive audit of the existing Process Flow Diagram (PFD), engineering teams identified that the crude preheat train was bypassing a critical pinch point in the Heat and Material Balance (HMB).
The Problem
The original PFD lacked detailed enthalpy data for stream #42 (Crude Feed), leading to an undersized shell-and-tube exchanger. This resulted in excessive fuel gas consumption in the fired heater.
The Solution
Engineers revised the Process Flow Diagram (PFD) to include a secondary heat exchange loop. This modification was validated using the ASME Boiler and Pressure Vessel Code (BPVC) for the new vessel ratings.
Key Result:
- Reduction in furnace fuel consumption by 12%.
- Payback period for equipment modifications: 8 months.
- Updated PFD now serves as the primary training document for new plant operators.
Interactive PFD Stream Summary Table (Example)
| Stream No. | Description | Temp (°C) | Press. (kg/cm²) | Phase |
|---|---|---|---|---|
| 101 | Crude Feed Inlet | 35.0 | 5.5 | Liquid |
| 102 | Pre-heated Crude | 145.0 | 4.8 | Liquid |
| 103 | Flash Zone Vapor | 360.0 | 1.2 | Vapor |
Expert Insights: Lessons from 20 years in the field
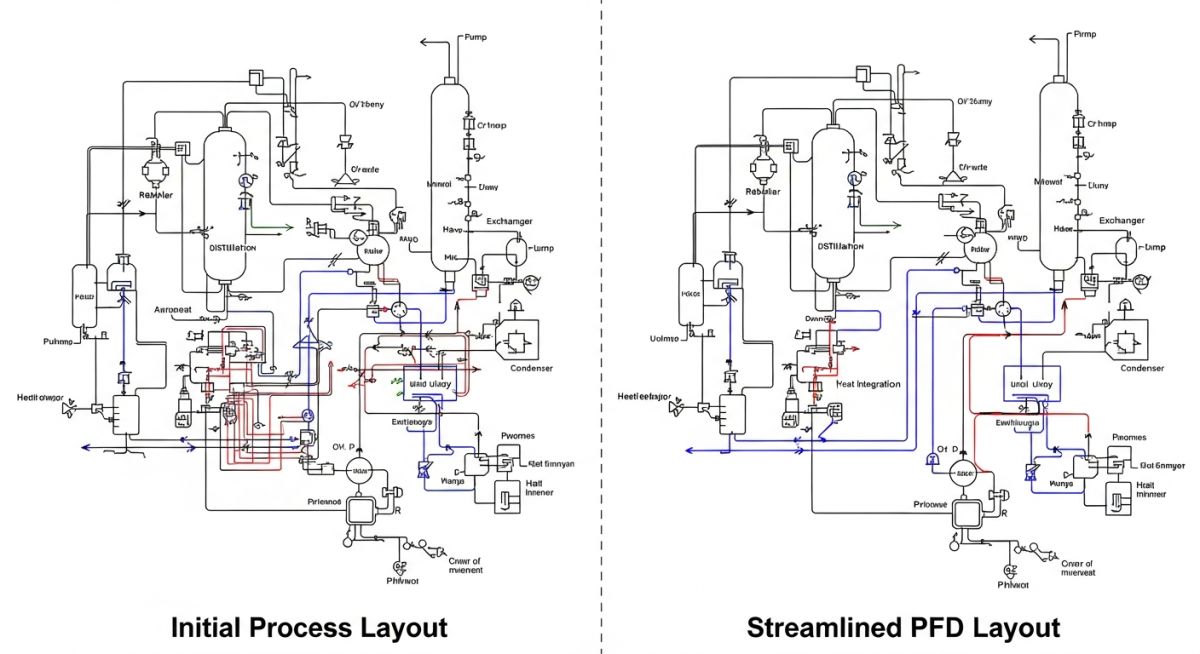
Avoid "P&ID Creep" on your PFD
One of the most common mistakes is cluttering a Process Flow Diagram (PFD) with minor valves or instrumentation details. Keep the PFD clean to ensure the thermodynamics and mass balance remain the focus. If you can't see the flow path at a glance, you've added too much mechanical detail.
Validate Mass Balance Closures
In every PFD audit, check that the sum of the inlets equals the sum of the outlets within a 0.5% margin. Large deviations often hide calculation errors in recycle loops or flash calculations that can lead to massive equipment undersizing during procurement.
Streamline the Naming Convention
Standardize your stream numbering logic (e.g., 100-series for Feed, 200-series for Reactor section). This makes the Process Flow Diagram (PFD) much easier to navigate during multidisciplinary reviews and HAZOP sessions.
References & Standards
Master PFD Design
Enhance your professional portfolio by mastering industrial drawing standards through these curated engineering programs.
EPCLand YouTube Channel
2,500+ Videos • Daily Updates
Process Flow Diagram (PFD) Authority FAQ
What is the difference between a PFD and a Block Flow Diagram (BFD)?
Which software is commonly used to create professional PFDs?
Are utility lines shown on a standard PFD?
How do I handle a "Recycle Loop" in a PFD mass balance?
Why did my HAZOP chairman ask for the PFD instead of the P&ID?
What happens if my PFD stream temperature exceeds the pipe rating?
📚 Recommended Resources: Process Flow Diagram (PFD)

Related posts:
![Pressure vessel fabrication process in industrial workshop with welding and rolling operations]()
Pressure Vessel Fabrication Process Explained for Industrial Projects
![Pressure vessel vs storage tank visual comparison industrial equipment]()
Pressure Vessels vs Storage Tanks Major Differences
![“Poisson’s ratio showing axial elongation and lateral contraction in engineering material”]()
Poisson’s Ratio Explained With Formula, Examples and Engineering Significance
![Emergency Shutdown System layout in industrial plant with ESD valves and safety instrumentation]()
Emergency Shutdown System Design Working Components and Safety Logic
![Project kick-off meeting discussion in engineering project planning room]()
Project Kick-Off Meeting Meaning Purpose and Agenda Explained
![Surge relief valve protecting pipeline from pressure surge and water hammer]()
Surge Relief Valve Design Function Types and Selection Guide