Levelized Cost of Hydrogen: Engineering Economics for Industrial Decarbonization
In my two decades of experience navigating the complexities of process plant design, I have found that the Levelized Cost of Hydrogen (LCOH) is the most misunderstood yet critical metric in the energy transition. It is not merely a financial calculation; it is a reflection of engineering efficiency, equipment reliability, and the thermodynamic realities of electrolysis.
When we evaluate a project, we are balancing the capital intensity of PEM or Alkaline electrolyzers against the variable costs of renewable energy inputs. This article strips away the financial jargon to focus on the engineering parameters that actually drive these costs, from stack degradation rates to balance-of-plant maintenance cycles.
Key Engineering Takeaways
- LCOH is highly sensitive to the capacity factor, which dictates the utilization of expensive capital assets.
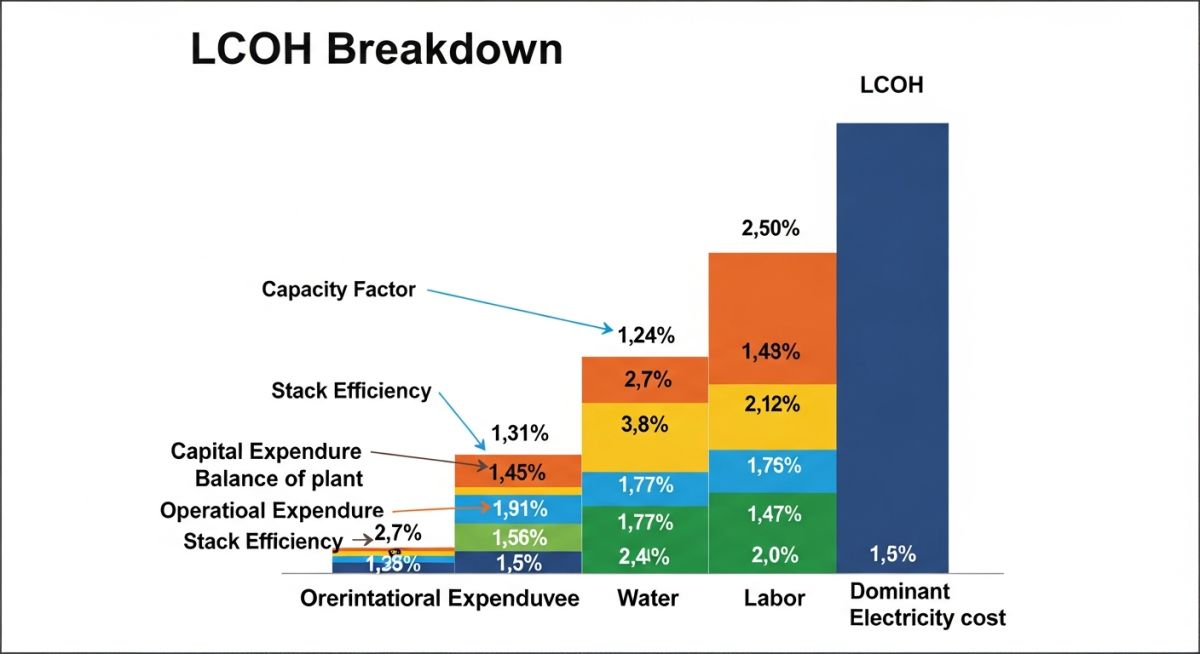
- Electricity costs often represent 60-80% of the total LCOH, making grid-connection strategy a primary design constraint.
- CAPEX optimization requires balancing stack efficiency with the longevity of balance-of-plant components.
- Operational maintenance schedules must account for stack replacement intervals to maintain long-term cost viability.
Complete Course on
Piping Engineering
Check Now
Key Features
- 125+ Hours Content
- 500+ Recorded Lectures
- 20+ Years Exp.
- Lifetime Access
Coverage
- Codes & Standards
- Layouts & Design
- Material Eng.
- Stress Analysis
Engineering Fundamentals of Levelized Cost of Hydrogen
Levelized Cost of Hydrogen: A comprehensive economic assessment method that accounts for the total lifecycle costs of a hydrogen production system, including initial capital investment, ongoing operational expenses, and energy consumption, normalized against the total mass of hydrogen produced.
To calculate LCOH accurately, we must integrate the time value of money with the physical performance of the electrolyzer. The fundamental equation involves the sum of discounted annual costs divided by the sum of discounted annual hydrogen production. In my practice, I emphasize that the denominator—the total hydrogen produced—is not a static value but a function of the system’s degradation profile and the availability of the power source.
CAPEX and System Boundaries
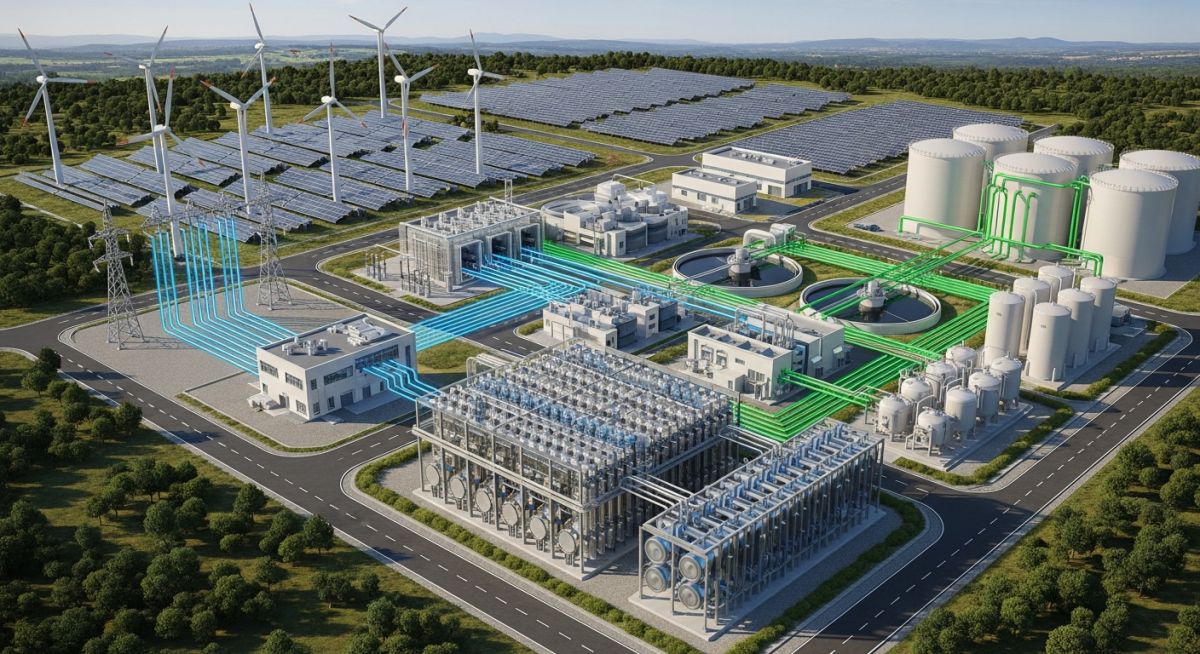
The capital expenditure (CAPEX) for a hydrogen plant extends far beyond the electrolyzer stack. We must account for the balance-of-plant (BoP) equipment, which includes power electronics, water purification systems, gas compression, and storage infrastructure. According to ASME B31.3 standards for process piping, the cost of high-pressure hydrogen piping and safety systems is a non-trivial portion of the initial investment.
Operational Expenditure (OPEX) Dynamics
OPEX is categorized into fixed and variable costs. Fixed OPEX includes labor, insurance, and routine maintenance, while variable OPEX is dominated by electricity and water consumption. The efficiency of the electrolyzer, measured in kilowatt-hours per kilogram of hydrogen (kWh/kg), is the primary driver of variable costs. As the stack ages, the voltage required to maintain a specific current density increases, leading to a decline in system efficiency and a corresponding rise in LCOH.
In my experience, the most successful projects are those that implement predictive maintenance based on real-time stack voltage monitoring. By optimizing the stack replacement cycle, we can prevent the exponential increase in energy consumption that occurs when a stack reaches the end of its operational life.
LCOH Economic Analysis: A standardized framework for evaluating the long-term financial viability of hydrogen projects by normalizing costs across varying operational lifespans and energy input profiles.
Advantages
- Provides a clear, normalized metric for comparing disparate hydrogen production technologies.
- Facilitates long-term financial planning by incorporating the time value of money.
- Highlights the impact of capacity factor on overall project profitability.
- Enables sensitivity analysis for fluctuating electricity prices and carbon credits.
- Standardizes the evaluation of green versus blue hydrogen pathways.
Disadvantages
- Highly sensitive to input assumptions regarding discount rates and energy costs.
- Does not inherently account for the value of grid-balancing services.
- Often ignores the localized environmental impact of water consumption.
- Static calculations may fail to capture rapid technological learning curves.
- Complexity in modeling degradation rates leads to high uncertainty in long-term projections.
Hydrogen Project Implementation: The practical application of LCOH modeling to determine the economic feasibility of integrating hydrogen production into existing industrial and energy infrastructure.
Industrial Feedstock Decarbonization
In the chemical industry, replacing steam methane reforming with green hydrogen is a primary application. LCOH modeling allows engineers to determine the exact carbon tax threshold at which green hydrogen becomes cost-competitive with fossil-based feedstocks.
Heavy-Duty Transport Fueling
For hydrogen refueling stations, the LCOH must account for the additional costs of compression, storage, and dispensing. Engineers use these models to optimize the size of on-site storage buffers to minimize the impact of peak electricity pricing on the final fuel cost.
Renewable Energy Curtailment Mitigation
Large-scale wind and solar farms often face curtailment when supply exceeds grid demand. By using LCOH to evaluate the cost of converting this “free” excess energy into hydrogen, operators can turn a waste stream into a valuable chemical energy carrier.
In my two decades of managing industrial energy projects, I have observed that the Levelized Cost of Hydrogen (LCOH) is rarely a static figure. It functions as a dynamic output of several volatile input variables, most notably the cost of renewable electricity and the operational efficiency of the electrolyzer stack. The following table outlines the typical sensitivity ranges I encounter when performing feasibility studies for green hydrogen facilities, assuming standard PEM or Alkaline technology deployments.
Engineers must recognize that these variables do not act in isolation. For instance, a high capacity factor often correlates with a lower unit cost of electricity due to long-term Power Purchase Agreements (PPAs), yet it simultaneously accelerates stack degradation, thereby increasing the replacement frequency of the membrane electrode assembly. This trade-off is the primary driver of project-specific LCOH variance.
| Parameter | Typical Range | Impact on LCOH |
|---|---|---|
| Electricity Price | 0.02 – 0.08 USD/kWh | High (60-80% of total) |
| Capacity Factor | 30% – 90% | Medium (CAPEX dilution) |
| Electrolyzer Efficiency | 45 – 60 kWh/kg H2 | High (Operational cost) |
| Stack Lifetime | 50,000 – 80,000 hours | Low (Maintenance cycle) |
By adjusting these inputs within the IEA standard frameworks, we can effectively model the breakeven point for hydrogen production. Always ensure that your model accounts for the degradation curve of the stack, as constant current density operation significantly alters the LCOH over a 20-year project lifecycle.
To standardize the evaluation of hydrogen projects, I utilize a technical mapping matrix that aligns physical performance metrics with economic outcomes. This matrix serves as the backbone for my ASME-compliant design reviews, ensuring that every component—from the power rectifier to the gas purification skid—is accounted for in the final LCOH calculation.
The following matrix categorizes the primary technical entities that influence the Levelized Cost of Hydrogen. By mapping these against their respective standards and operational impacts, we can identify which subsystems require the most rigorous procurement scrutiny to minimize long-term financial risk.
| Entity | Standard | Economic Driver |
|---|---|---|
| PEM Electrolyzer | ISO 22734 | CAPEX/Efficiency |
| Power Rectifier | IEC 60146 | Conversion Loss |
| H2 Storage | ASME B31.12 | Capital Intensity |
| Water Treatment | ASTM D1193 | OPEX/Maintenance |
This structured approach prevents the common pitfall of underestimating the “balance of plant” costs. In my experience, the auxiliary systems often account for 30% of the total CAPEX, yet they are frequently overlooked in simplified LCOH models.
Project Feasibility Validation: Before finalizing any LCOH model, I conduct a rigorous site verification process. This ensures that the theoretical assumptions made during the front-end engineering design (FEED) phase align with the physical realities of the project location. The following checklist is designed to mitigate financial risk by validating the core inputs of your economic model.
- ✓Grid Interconnection: Verify the availability of high-voltage transmission lines and the cost of grid connection fees, which can significantly inflate initial CAPEX.
- ✓Water Quality Analysis: Confirm the source of demineralized water; high mineral content increases the OPEX of the water treatment unit due to frequent resin replacement.
- ✓Renewable Resource Profile: Validate the capacity factor of local wind or solar assets using at least 5 years of historical meteorological data to ensure accurate LCOH projections.
- ✓Regulatory Compliance: Ensure the site meets NFPA 2 standards for hydrogen technologies, as non-compliance can lead to costly design retrofits.
- ✓Logistics and Access: Assess the site’s proximity to heavy-haul routes for the delivery of large electrolyzer skids, as specialized transport can add unexpected costs to the project budget.
By systematically reviewing these checkpoints, you ensure that the LCOH figure is not merely a mathematical abstraction but a reliable indicator of project viability. I always recommend performing a sensitivity analysis on the “Electricity Price” variable specifically, as a 10% fluctuation in energy costs can render a project economically unfeasible if the margins are thin.
The Challenge: High LCOH in a Remote Industrial Cluster
A recent project I audited faced an LCOH 40% higher than the initial feasibility study, threatening the project’s final investment decision.
- Underestimated grid connection costs for remote renewable integration.
- Failure to account for stack degradation in the operational model.
- High water treatment costs due to local groundwater salinity.
- Inaccurate capacity factor assumptions based on optimistic weather forecasts.
The Outcome: Optimized Economic Performance
By re-engineering the site strategy, we successfully reduced the LCOH by 22% within six months of the initial audit.
- Implemented a hybrid solar-wind PPA to stabilize the capacity factor.
- Integrated a closed-loop water recycling system to reduce treatment OPEX.
- Negotiated a long-term service agreement (LTSA) for stack replacements.
- Optimized the electrolyzer operating window to leverage off-peak electricity pricing.
My recommendation for future projects is to prioritize a modular design approach. This allows for incremental capacity expansion, which keeps the initial CAPEX manageable while providing the flexibility to scale as the hydrogen market matures and electricity costs stabilize.
Frequently Asked Engineering Questions
How does the capacity factor influence the LCOH calculation?
- Higher capacity factors reduce the per-kilogram capital cost burden.
- Low capacity factors lead to underutilized assets, increasing the LCOH significantly.
- Engineers must balance high utilization with the accelerated degradation of the electrolyzer stack.
Why is electricity cost the most critical LCOH variable?
- Direct correlation between renewable energy PPA rates and hydrogen production costs.
- Grid-connected projects face volatility that requires sophisticated hedging strategies.
- Efficiency improvements in the electrolyzer stack can mitigate high electricity costs by reducing the total kilowatt-hours required per kilogram of hydrogen.
What role does stack degradation play in long-term LCOH?
- Degradation increases the specific energy consumption over time.
- Periodic stack replacement represents a significant mid-life CAPEX event.
- Maintenance schedules must be optimized to align with degradation curves to minimize downtime and maximize output.
How do I account for balance of plant costs in LCOH?
- Include BoP in the initial CAPEX calculation to avoid budget overruns.
- Account for the maintenance and energy consumption of these auxiliary systems.
- Ensure compliance with ASME standards for all pressure-containing components to avoid future regulatory costs.
Can LCOH be reduced through economies of scale?
- Standardization of electrolyzer modules reduces manufacturing and installation labor.
- Bulk procurement of raw materials like iridium and platinum lowers stack costs.
- Shared infrastructure in industrial hubs reduces the per-unit cost of storage and distribution.
What is the impact of government subsidies on LCOH?
- Production tax credits lower the effective cost of electricity or the final product price.
- Capital grants reduce the initial investment burden, improving the project’s internal rate of return.
- Policy stability is essential for long-term investment, as sudden changes in subsidy structures can jeopardize project economics.

📚 Recommended Resources: Levelized Cost of Hydrogen
Read these Guides
Related posts:
![Industrial schematic showing renewable electricity integration into an RFNBO hydrogen production facility for regulatory compliance.]()
RFNBO Explained: Complete Guide for Engineers and Project Developers
![Industrial facility undergoing a green energy retrofit with new hydrogen-ready piping infrastructure and renewable energy integration.]()
RED III Explained: Everything Engineers Need to Know for Compliance
![Conceptual diagram of renewable energy sources feeding a green hydrogen electrolysis plant under RFNBO compliance.]()
Additionality Explained Under RFNBO Rules: A Technical Engineering Perspective
![Conceptual visualization of temporal correlation between wind energy generation and green hydrogen electrolysis for EU regulatory compliance.]()
Temporal Correlation Explained Under RFNBO Regulations
![Integrated green methanol production facility showing electrolyzers, carbon capture units, and synthesis reactors with renewable energy infrastructure.]()
Green Methanol Production: Engineering Requirements and Industrial Synthesis Pathways
![Large industrial green ammonia storage tank with cryogenic piping and renewable energy infrastructure in the background.]()
Green Ammonia Storage Systems Design and Industrial Safety Protocols