Top Instrumentation Engineering Deliverables for Oil and Gas Projects
In my 20 years of executing multi-billion dollar upstream and downstream projects, I have seen projects succeed or fail based on the quality of their engineering documentation. When a plant goes into emergency shutdown, or when a commissioning team is tracing a loop on a freezing offshore platform, they do not care about high-level project management slides. They care about the accuracy of the instrument index, the loop diagrams, and the datasheets. These documents are not just administrative milestones; they are the operational DNA of the facility.
Throughout my career, I have audited engineering packages where a single misplaced digit in a control valve datasheet led to millions of dollars in procurement delays and field rework. To prevent these catastrophic bottlenecks, a disciplined approach to generating and verifying instrumentation engineering deliverables is mandatory. Let us break down the core documents that form the backbone of any robust oil and gas automation design.
Key Takeaways for Project Managers and Lead Engineers
- The Instrument Index is the single source of truth; keep it dynamically linked to the P&ID database.
- Control valve and relief valve datasheets require rigorous process data validation before procurement.
- Loop diagrams and hook-up drawings must reflect actual physical site constraints to avoid field modifications.
Complete Course on
Piping Engineering
Check Now
Key Features
- 125+ Hours Content
- 500+ Recorded Lectures
- 20+ Years Exp.
- Lifetime Access
Coverage
- Codes & Standards
- Layouts & Design
- Material Eng.
- Stress Analysis
Why Instrumentation Engineering Deliverables Drive Project Success
The design of an oil and gas facility is a highly iterative process. Instrumentation engineering acts as the nervous system of the plant, connecting the physical piping and vessels (the muscles) to the control room (the brain). Without highly accurate instrumentation engineering deliverables, the construction team cannot run cables, the piping team cannot install inline valves, and the software team cannot program the Distributed Control System (DCS) or Safety Instrumented System (SIS).
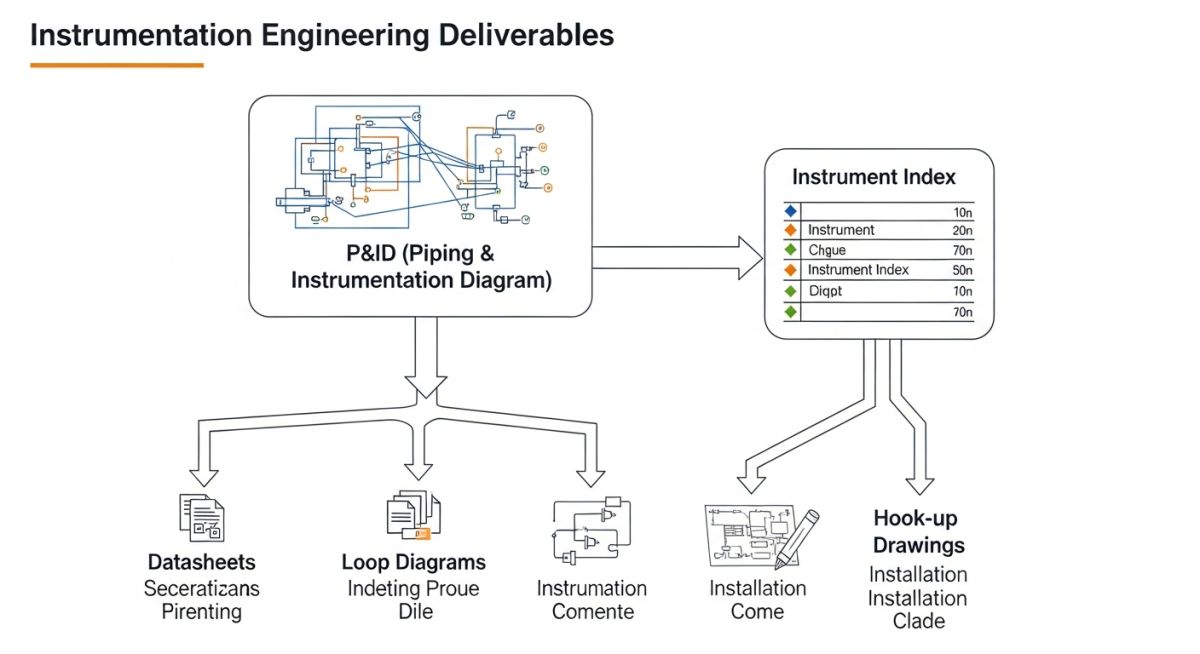
To understand the depth of these deliverables, we must look at how they are generated. The process begins with the Process Flow Diagrams (PFDs) and Piping and Instrumentation Diagrams (P&IDs). Once the P&IDs are approved, the instrumentation team extracts every single tagged item to populate the master Instrument Index. This index then drives the creation of datasheets, wiring diagrams, loop drawings, and physical installation details.
The Mathematics of Control Valve Sizing
One of the most critical tasks in instrumentation engineering is the sizing of control valves. This is not a guessing game; it is governed by strict thermodynamic and fluid dynamic equations defined in the ISA-5.1 Standard and IEC 60534.
To calculate the required flow coefficient (Cv) for a liquid service, we use the standard formula:
Where:
- Q is the maximum flow rate in gallons per minute (gpm).
- G is the specific gravity of the liquid at the operating temperature.
- delta_P is the pressure drop across the valve in pounds per square inch (psi) under maximum flow conditions.
For gas or vapor service, the calculation becomes significantly more complex because we must account for compressibility, temperature, and the ratio of specific heats to prevent choked flow conditions. If the pressure drop across the valve exceeds half of the absolute upstream pressure, choked flow occurs, and the formula must be adjusted using the expansion factor (Y).
Safety Instrumented Systems (SIS) and SIL Ratings
In modern oil and gas facilities, safety is paramount. The design of Safety Instrumented Systems (SIS) must comply with IEC 61511. This involves determining the Safety Integrity Level (SIL) for each safety loop. The instrumentation team must deliver SIL calculation reports that prove the Probability of Failure on Demand (PFDavg) of the entire loop (sensor, logic solver, and final control element) meets the target SIL rating.
Technical Specifications for Control System Deliverables
Below is a comprehensive breakdown of the primary instrumentation engineering deliverables, their purpose, governing standards, and the typical software tools used in the industry to generate them.
| Deliverable Name | Primary Purpose | Governing Standard | Industry Software |
|---|---|---|---|
| Instrument Index | Master list of all tagged instruments with physical and electrical properties. | ISA-5.1 | SmartPlant Instrumentation (SPI) |
| Instrument Datasheets | Detailed technical specifications for purchasing and calibration. | ISA-20 / API RP 551 | SPI / Conval / Excel |
| Loop Diagrams | Point-to-point wiring from field instrument to junction box and DCS/SIS. | ISA-5.4 | SPI / AutoCAD |
| Hook-up Drawings | Physical installation details showing piping, tubing, valves, and fittings. | Process Industry Practices (PIP) | AutoCAD / MicroStation |
| Cause and Effect Matrix | Logic mapping showing which process inputs trigger specific safety outputs. | ISO 10418 / API RP 14C | Excel / Word |
This matrix maps the core technical entities, structural acronyms, and physical parameters associated with instrumentation design in oil and gas facilities.
| Entity / Acronym | Full Description | Physical / Design Parameter | Reference Standard |
|---|---|---|---|
| DCS | Distributed Control System | Analog/Digital I/O, Scan Time, Controller Redundancy | API RP 554 |
| SIS | Safety Instrumented System | Safety Integrity Level (SIL 1-4), PFDavg | IEC 61508 / 61511 |
| F&G | Fire and Gas System | Detector Coverage, Voting Logic (1oo2, 2oo3) | NFPA 72 |
| JB | Junction Box | Ingress Protection (IP66/67), Hazardous Area Rating | IEC 60079 |
Managing Critical Instrumentation Engineering Deliverables Safely
Before any instrumentation package is issued for construction (IFC), it must undergo a rigorous inter-disciplinary review. As a piping and instrumentation specialist, I have developed this checklist to ensure that the physical installation matches the theoretical design.
Pre-Commissioning & Design Verification Checklist
-
P&ID Alignment: Verify that every instrument tag on the P&ID matches the Instrument Index, Datasheet, and Loop Diagram exactly.
-
Hazardous Area Compliance: Ensure the instrument’s explosion-proof or intrinsically safe rating matches the hazardous area classification drawing (e.g., Class I, Div 1 / Zone 1).
-
Physical Accessibility: Confirm that transmitters, control valves, and local indicators are accessible from platforms or grade for maintenance and calibration.
-
Straight Run Requirements: Check that flow meters (especially orifice plates and vortex meters) have the required upstream and downstream straight piping runs as specified by the manufacturer and ISO 5167.
-
Material Compatibility: Cross-reference the wetted parts material on the datasheet with the piping class specification to prevent galvanic corrosion.
Field Case Study: Real-World Application
The Problem: Severe Cavitation and Piping Vibration
During the commissioning of a water injection facility in the Middle East, the team reported extreme vibration and deafening noise coming from a 6-inch high-pressure control valve. The piping supports were cracking, and the pressure transmitter downstream was failing repeatedly due to high-frequency vibration. The project was on the verge of a costly shutdown.
The Outcome: Datasheet Audit and Trim Redesign
I was called in to audit the instrumentation engineering deliverables. Upon reviewing the control valve datasheet, I discovered that the process team had provided a single operating case. They had omitted the low-flow, high-pressure-drop startup case. The valve was operating at a 15% opening with a pressure drop of 120 bar, causing severe cavitation.
By recalculating the Cv using the actual startup parameters and referencing ISA-5.1 guidelines, we redesigned the valve trim to a multi-stage anti-cavitation design. We also updated the hook-up drawings to relocate the downstream pressure transmitter further away from the turbulence zone. The vibration levels dropped by 85%, saving the project from a multi-million dollar redesign.
This case study highlights why instrumentation deliverables cannot be treated as isolated documents. They must be dynamically linked to the process conditions and physical piping layouts.
Frequently Asked Engineering Questions
What is the difference between an Instrument Index and an I/O List?
Why are hook-up drawings critical for construction contractors?
How does IEC 61511 impact instrumentation deliverables?
What is the purpose of a Cause and Effect Matrix?
How do you handle changes to deliverables during construction?
Why is SmartPlant Instrumentation (SPI) widely used?

📚 Recommended Resources: instrumentation engineering deliverables
Read these Guides
🎓 Advanced Training


Related posts:
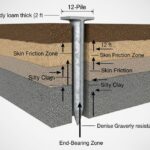
![Cross-section diagram showing a steel solar pile foundation embedded in layered soil profiles for structural analysis.]()
Essential Geotechnical Pile Design Data for Utility-Scale Solar Structures
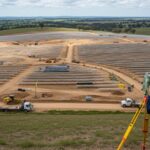
![Professional surveyor conducting Topographical Surveys for Solar Projects on a large-scale utility site with complex terrain.]()
Topographical Surveys for Solar Projects: A Technical Engineering Guide
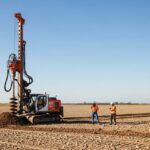
![A geotechnical drill rig performing soil sampling on a large, open field intended for a utility-scale solar farm project.]()
Geotechnical Investigation for Solar Farms: Essential Site Design Guide
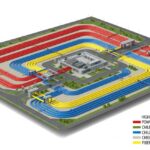
![Isometric site plan showing Utility Corridor Planning for Data Centres with color-coded power, water, and telecom infrastructure paths.]()
Utility Corridor Planning for Data Centres: A Strategic Engineering Guide
![Aerial view of a data centre site showcasing perimeter drainage systems, detention basins, and site grading for flood prevention.]()
Drainage Design Considerations for Data Centres: A Technical Guide
![Professional surveyor using a Total Station on a large data centre construction site for topographical mapping.]()
Topographical Surveys for Data Centre Projects: A Technical Guide