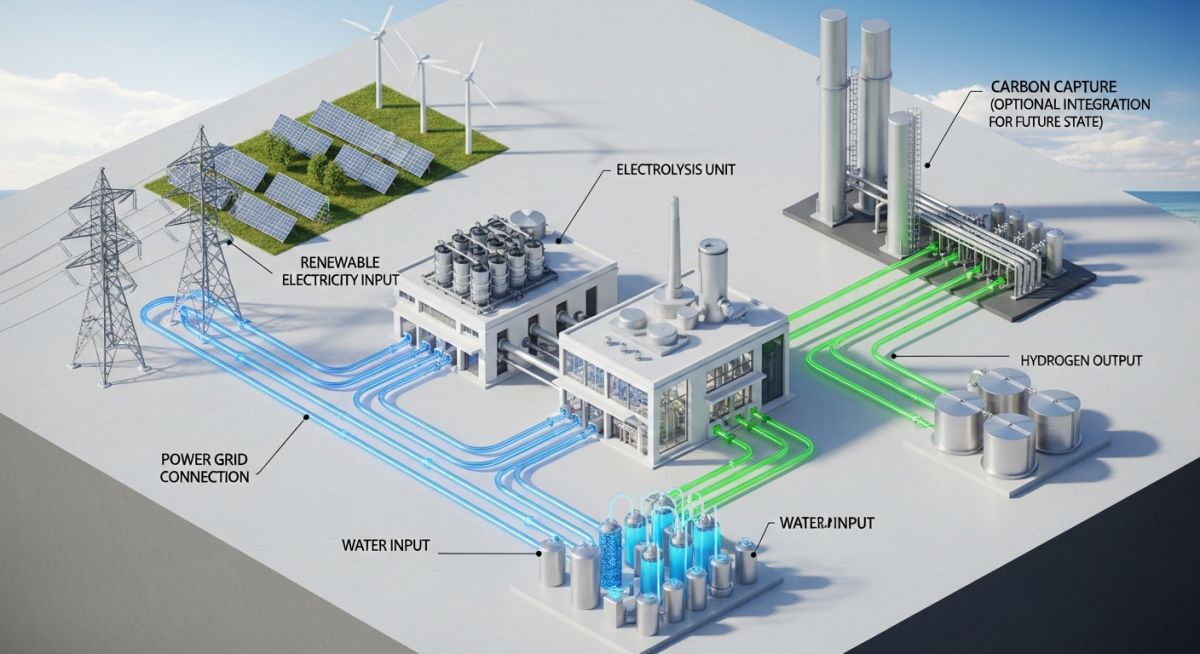
GHG Calculation Methodology for RFNBO Projects: A Technical Guide
In my two decades of experience within the process and piping sector, I have observed that the transition to green hydrogen is not merely a mechanical challenge but a rigorous accounting exercise. For any project involving Renewable Fuels of Non-Biological Origin (RFNBO), the ability to calculate and verify greenhouse gas (GHG) emissions is the difference between a viable asset and a stranded one. We are no longer just designing for pressure and temperature; we are designing for carbon intensity (CI) limits.
This guide dissects the methodology required to navigate the complex regulatory landscape of the European Union’s Renewable Energy Directive (RED III). We will move beyond high-level policy to examine the specific emission factors, boundary definitions, and calculation pathways that dictate whether your hydrogen production facility meets the 70% GHG savings threshold compared to fossil fuel comparators.
Key Takeaways for Engineers:
- Mastering the 70% GHG reduction threshold against the fossil fuel comparator.
- Understanding the temporal and geographical correlation requirements for renewable electricity.
- Applying the life-cycle assessment (LCA) boundaries from cradle-to-gate.
- Navigating the specific emission factors for grid-connected vs. off-grid electrolysis.
Complete Course on
Piping Engineering
Check Now
Key Features
- 125+ Hours Content
- 500+ Recorded Lectures
- 20+ Years Exp.
- Lifetime Access
Coverage
- Codes & Standards
- Layouts & Design
- Material Eng.
- Stress Analysis
GHG Calculation Methodology for RFNBO Projects
RFNBO Emission Quantification: The rigorous application of life-cycle assessment principles to determine the total carbon footprint of hydrogen production, including upstream, operational, and downstream emission vectors.
To calculate the GHG emissions of an RFNBO project, we must adhere to the methodology defined in the EU RED III framework. The total emissions (E) are expressed as the sum of emissions from the extraction or cultivation of raw materials (e_ec), the annualized emissions from carbon stock changes (e_l), the emissions from processing (e_p), the emissions from transport and distribution (e_td), and the emissions from the fuel in use (e_u). For hydrogen, the primary focus lies in the processing (e_p) and electricity input (e_ee).
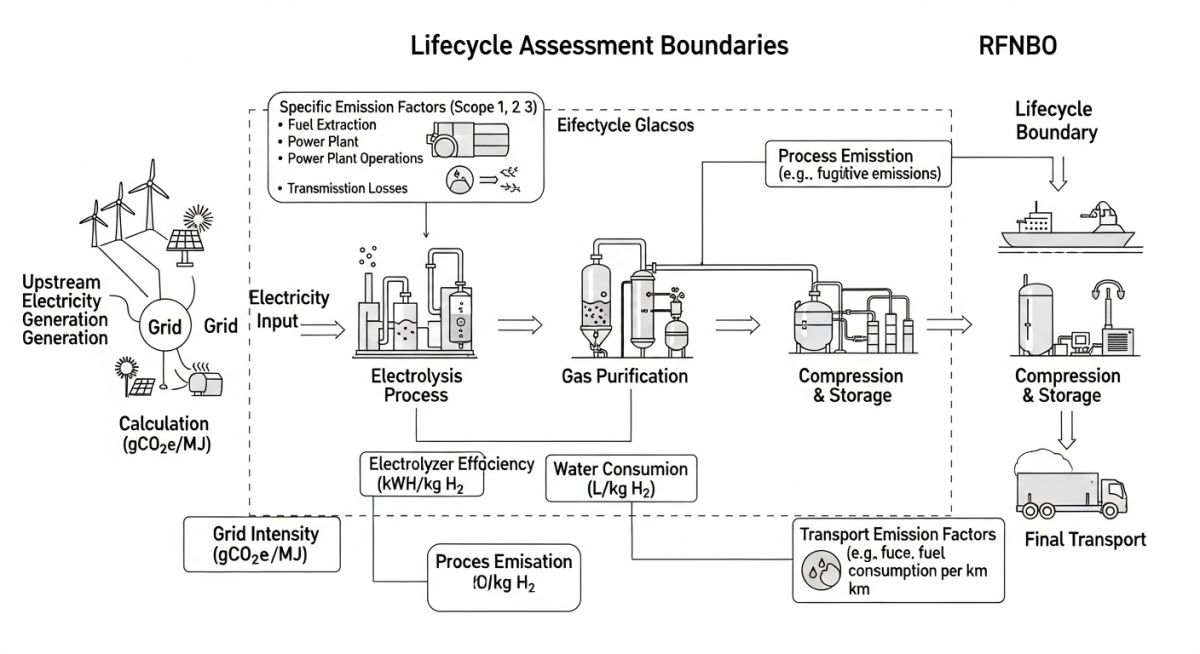
The electricity emission factor (e_ee) is the most critical variable. If the electricity is sourced from the grid, the emission intensity is calculated based on the average carbon intensity of the grid in the bidding zone, adjusted for the share of renewable energy. However, if the project utilizes a Power Purchase Agreement (PPA), we must prove additionality, temporal correlation (hourly matching), and geographical correlation. The formula for electricity emissions is: E_ee = (Q_el * C_el) / η, where Q_el is the electricity quantity, C_el is the carbon intensity of the source, and η is the electrolyzer efficiency.
Engineering Warning: Temporal Correlation
Starting in 2030, the EU mandates hourly matching for renewable electricity. If your electrolyzer operates during a period where the PPA-backed renewable source is not generating, you must account for the grid’s marginal emission factor, which can drastically increase your CI score and disqualify the hydrogen as “renewable.”
When calculating processing emissions (e_p), we must include the energy required for water purification, compression, and cooling. In my experience, engineers often overlook the fugitive emissions of hydrogen itself, which, while not a direct GHG, has an indirect global warming potential that regulators are increasingly scrutinizing. We must also account for the emissions associated with the construction of the electrolyzer plant, amortized over the expected lifetime of the facility (typically 20 years).
The final threshold check requires comparing your calculated E value against the fossil fuel comparator (currently set at 94g CO2eq/MJ). Your project must demonstrate a 70% reduction, meaning your total emissions must remain below 28.2g CO2eq/MJ. This requires precise instrumentation and data logging at the plant level to provide the audit trail necessary for certification under schemes like CertifHy or ISCC PLUS.
RFNBO Compliance Trade-offs: The strategic evaluation of the technical and economic impacts of adhering to stringent GHG accounting standards in hydrogen production.
Advantages
- Access to premium green hydrogen markets and subsidies.
- Future-proofing assets against tightening carbon taxes (CBAM).
- Enhanced operational efficiency through rigorous energy monitoring.
- Stronger ESG reporting metrics for institutional investors.
- Alignment with global decarbonization standards like RED III.
Disadvantages
- High administrative burden for continuous data logging.
- Increased CAPEX for advanced metering and control systems.
- Complexity in managing hourly temporal correlation requirements.
- Risk of non-compliance due to grid emission factor volatility.
- Higher operational costs for dedicated renewable energy sourcing.
Industrial Decarbonization Pathways: The practical implementation of RFNBO GHG accounting across diverse heavy industry sectors to achieve net-zero operational targets.
Green Steel Manufacturing
Integrating RFNBO hydrogen into Direct Reduced Iron (DRI) processes requires precise GHG accounting to ensure the final steel product qualifies as “green.” Engineers must track the carbon intensity of the hydrogen input to ensure the total process emissions remain within the strict limits required for low-carbon steel certification.
Sustainable Aviation Fuel (SAF) Production
The production of e-kerosene via the Power-to-Liquid (PtL) pathway relies heavily on the carbon intensity of the hydrogen feedstock. By applying the RFNBO methodology, producers can verify that their synthetic fuels meet the mandatory GHG reduction targets set by the ReFuelEU Aviation initiative.
Ammonia Synthesis for Fertilizer
Transitioning from steam methane reforming to electrolysis for ammonia production necessitates a full life-cycle GHG audit. This application focuses on the integration of renewable energy inputs to ensure the resulting green ammonia maintains a low carbon footprint throughout the supply chain.
Accurate GHG accounting for Renewable Fuels of Non-Biological Origin (RFNBO) requires precise selection of emission factors. These values are derived from life cycle assessment (LCA) databases and must align with the EU Renewable Energy Directive (RED III). Engineers must distinguish between direct combustion emissions, upstream supply chain impacts, and grid-related carbon intensity.
The following table outlines standard emission intensity benchmarks used in industrial hydrogen production. These figures represent the carbon footprint per unit of energy or mass, serving as the baseline for calculating the 70% GHG reduction threshold required for RFNBO certification. Always verify these factors against the specific ISO 14067 product carbon footprint standards before finalizing your project documentation.
| Emission Source | Unit | Typical Factor (gCO2e/MJ) | Standard Reference |
|---|---|---|---|
| Grid Electricity (EU Mix) | gCO2e/kWh | 250 – 300 | RED III Annex V |
| Water Electrolysis (Direct) | gCO2e/kg H2 | 0.00 | ISO 14067 |
| Natural Gas (Upstream) | gCO2e/MJ | 15.5 | RED III Default |
| Compression Energy | gCO2e/kWh | 12.0 | Internal LCA |
When applying these factors, ensure that your methodology accounts for the temporal and geographical correlation of renewable energy procurement. Using average grid factors is often insufficient for RFNBO compliance; project-specific Power Purchase Agreements (PPAs) with hourly matching are increasingly required to demonstrate true additionality and low carbon intensity.
The complexity of RFNBO projects necessitates a structured approach to data management. This matrix maps the core technical entities involved in GHG accounting to their respective regulatory frameworks and physical parameters. By standardizing these inputs, engineering teams can ensure consistency across multi-site reporting and audit trails.
Each entity listed below represents a critical node in the life cycle assessment. Failure to accurately define these parameters can lead to non-compliance with the RED III Delegated Acts. Use this matrix as a foundational guide for building your internal GHG calculation software or spreadsheet models.
| Entity | Acronym | Parameter | Standard |
|---|---|---|---|
| Renewable Fuel Non-Biological Origin | RFNBO | Carbon Intensity | RED III |
| Power Purchase Agreement | PPA | Temporal Correlation | Delegated Act |
| Life Cycle Assessment | LCA | Global Warming Potential | ISO 14040 |
| Greenhouse Gas | GHG | CO2 Equivalent | GHG Protocol |
Engineers should note that the “Temporal Correlation” parameter is the most volatile variable in current RFNBO accounting. As regulations tighten, the requirement for hourly matching between renewable generation and hydrogen production will become the industry standard, effectively eliminating the use of annual average emission factors for grid-connected electrolyzers.
GHG Calculation Methodology Verification: Ensuring compliance with RED III requires a rigorous site-level verification process. This checklist serves as a baseline for project managers and lead engineers to validate that all emission sources are captured, quantified, and documented according to international standards.
- ☐ Renewable Energy Source Validation: Verify that all electricity inputs are backed by valid Guarantees of Origin (GOs) or PPAs that meet additionality criteria.
- ☐ Temporal Matching Audit: Confirm that the production schedule aligns with renewable generation intervals as per the latest EU Delegated Acts.
- ☐ Upstream Emission Inventory: Document all Scope 3 emissions associated with the manufacturing of electrolyzer stacks and balance-of-plant equipment.
- ☐ Transportation Logistics: Calculate the carbon footprint of hydrogen transport, including compression, liquefaction, and pipeline or truck distribution.
- ☐ Threshold Compliance Check: Perform a final calculation to ensure the total carbon intensity remains below the 94g CO2e/MJ threshold (or the 70% reduction target).
- ☐ Audit Trail Documentation: Archive all raw data, meter readings, and PPA contracts in a secure, tamper-proof system for third-party verification.
Site verification is not a one-time event but a continuous process. During the commissioning phase, I recommend installing high-precision sub-meters on all major energy-consuming equipment. This granular data is essential for defending your GHG calculations during regulatory audits. If your project utilizes grid-connected power, ensure that your data management system can handle the high-frequency sampling required to prove that your electrolyzer was not drawing power during periods of high grid carbon intensity.
Problem: Grid-Connected Electrolyzer Non-Compliance
A 20MW PEM electrolysis project failed its initial GHG audit due to poor temporal correlation between wind energy production and hydrogen output.
- Lack of hourly matching between wind farm generation and electrolyzer operation.
- Reliance on annual average grid emission factors instead of marginal factors.
- Incomplete documentation of upstream emissions for the electrolyzer stack.
- Failure to account for energy losses during the compression and storage phase.
Outcome: Achieving Regulatory Certification
The project team successfully remediated the carbon intensity profile by implementing a smart energy management system and updating the PPA structure.
- Implemented a real-time energy management system to synchronize production with wind availability.
- Renegotiated PPA to include strict hourly matching requirements for renewable energy.
- Updated the LCA model to include site-specific data for compression energy consumption.
- Achieved a 75% reduction in carbon intensity, exceeding the 70% RED III threshold.
In my experience, the most common pitfall in these projects is the assumption that “green” energy is inherently compliant. The regulatory landscape is moving toward strict, verifiable, and time-bound evidence. My recommendation is to integrate your GHG accounting software directly into the plant’s Distributed Control System (DCS). This allows for automated, real-time reporting that satisfies auditors and ensures that your project remains within the required carbon intensity thresholds throughout its operational life.
Frequently Asked Engineering Questions
What is the primary GHG threshold for RFNBOs?
- The fossil fuel comparator is set at 94g CO2e/MJ.
- Projects must demonstrate that their total life cycle emissions are below 28.2g CO2e/MJ.
- This calculation must include all upstream, production, and transportation emissions.
- Compliance is verified through independent third-party audits of the project’s LCA.
How is temporal correlation defined for electricity?
- Current regulations are transitioning toward hourly matching requirements.
- This ensures that the electrolyzer is not consuming fossil-based grid power during periods of low renewable generation.
- Engineers must use high-frequency data logging to prove this synchronization.
- Failure to meet these intervals can result in the electricity being classified as grid-average, which often exceeds the carbon intensity limit.
Are upstream emissions included in the calculation?
- This includes the carbon footprint of manufacturing the electrolyzer stacks.
- Emissions from the extraction and processing of raw materials for balance-of-plant equipment must be accounted for.
- Construction-related emissions for the hydrogen production facility are also included.
- Engineers should utilize ISO 14040/14044 standards to ensure a comprehensive boundary definition for these upstream impacts.
What role do Guarantees of Origin play?
- They provide a standardized way to track renewable energy from the source to the consumer.
- GOs must be cancelled in the registry to prevent double-counting of renewable attributes.
- While GOs are necessary, they are not sufficient on their own for RFNBO compliance; they must be paired with temporal and geographical correlation evidence.
- Always ensure that your GO procurement strategy aligns with the specific requirements of the EU Renewable Energy Directive.
How is transportation carbon accounted for?
- Pipeline transport emissions are typically lower than truck-based distribution.
- Energy used for compression stations must be included in the total carbon intensity calculation.
- If the hydrogen is liquefied, the energy-intensive cooling process must be fully accounted for.
- Engineers should use standard emission factors for the specific transport mode, adjusted for the actual distance and energy efficiency of the equipment.
Can I use average grid emission factors?
- Regulators require proof that the electricity used is truly renewable and additional.
- Average grid factors often mask the high carbon intensity of power used during peak demand periods.
- Project developers should focus on site-specific PPA data and hourly matching to ensure the carbon intensity remains within the allowed limits.
- Relying on average factors poses a significant risk of audit failure and loss of certification.

📚 Recommended Resources: Hydrogen
Read these Guides
- 📄 Levelized Cost of Hydrogen: Engineering Economics for Industrial Decarbonization
- 📄 Water Requirement for Green Hydrogen Plants: Engineering Design and Optimization
- 📄 SOEC Electrolyzer Explained: High Temperature Electrolysis for Green Hydrogen Production
- 📄 Understanding RFNBO Geographic Correlation Rules for Green Hydrogen Projects