Table of Contents

Why GIS in Petroleum and Pipeline Industry is Absolutely Critical
In my 20+ years of piping and pipeline engineering, I have seen projects succeed or fail based on the quality of their spatial data. Back in the late 1990s, we relied on paper alignment sheets and manual surveys that often led to costly field modifications. Today, the integration of Geographic Information Systems (GIS) has completely transformed how we design, construct, and maintain pipeline networks. A single georeferencing error can cost millions in pipeline rerouting or, worse, lead to catastrophic pipeline strikes during excavation.
When we design a pipeline corridor, we are not just laying steel in the ground; we are navigating a complex web of environmental constraints, land ownership, geotechnical hazards, and regulatory jurisdictions. GIS acts as the single source of truth, combining spatial data with engineering attributes to provide a comprehensive digital twin of the asset. This integration is not a luxury—it is a fundamental requirement for modern pipeline integrity management.
Key Takeaways from This Technical Guide:
- Understand how spatial data layers optimize pipeline routing and minimize environmental impact.
- Learn the mathematical models used for spatial risk assessment and corridor selection.
- Discover the critical role of GIS in identifying High Consequence Areas (HCAs) under ASME B31.8S.
- Explore real-world field verification protocols to ensure spatial database accuracy.
Implementing GIS in Petroleum and Pipeline Industry
To build a robust GIS framework for pipeline engineering, we must first establish a highly accurate Spatial Data Infrastructure (SDI). This involves integrating multiple data layers, including digital elevation models (DEM), soil resistivity maps, environmental boundaries, and existing utility crossings. Each layer must be precisely georeferenced to a common coordinate reference system (CRS) to prevent spatial offsets.
In my experience, one of the most powerful applications of GIS is in pipeline route optimization. Instead of manually drawing routes, we use a Weighted Overlay Analysis (WOA) to calculate the least-cost path. This mathematical model assigns weights to different spatial factors based on their engineering and environmental impact.
Mathematical Model: Weighted Overlay Analysis (WOA)
The total suitability score for any given pipeline grid cell is calculated using the following linear combination:
Total Suitability Score = (W1 * S1) + (W2 * S2) + (W3 * S3) + … + (Wn * Sn)
Where:
- W: The weight assigned to a specific spatial factor (the sum of all weights must equal 1.0).
- S: The suitability score of the cell for that factor (typically scaled from 1 to 10, where 10 represents the lowest cost/risk).
Let us look at a practical engineering example. Suppose we are routing a 24-inch natural gas pipeline under ASME B31.8. We define four critical spatial factors:
- Terrain Slope (W1 = 0.30): Steeper slopes increase construction costs and landslide risks.
- Environmental Sensitivity (W2 = 0.25): Wetlands and protected habitats increase permitting delays.
- Geotechnical Hazard (W3 = 0.25): Areas prone to soil liquefaction or seismic activity.
- Right-of-Way Acquisition Cost (W4 = 0.20): Land parcel values and easement complexity.
If a specific grid cell has a Slope Score of 8, an Environmental Score of 9, a Geotechnical Score of 5, and a Right-of-Way Score of 7, the calculation is:
Total Score = (0.30 * 8) + (0.25 * 9) + (0.25 * 5) + (0.20 * 7) = 2.40 + 2.25 + 1.25 + 1.40 = 7.30
By running this calculation across millions of grid cells, the GIS software generates a continuous suitability surface, allowing the engineering team to select the path of least resistance and lowest risk.
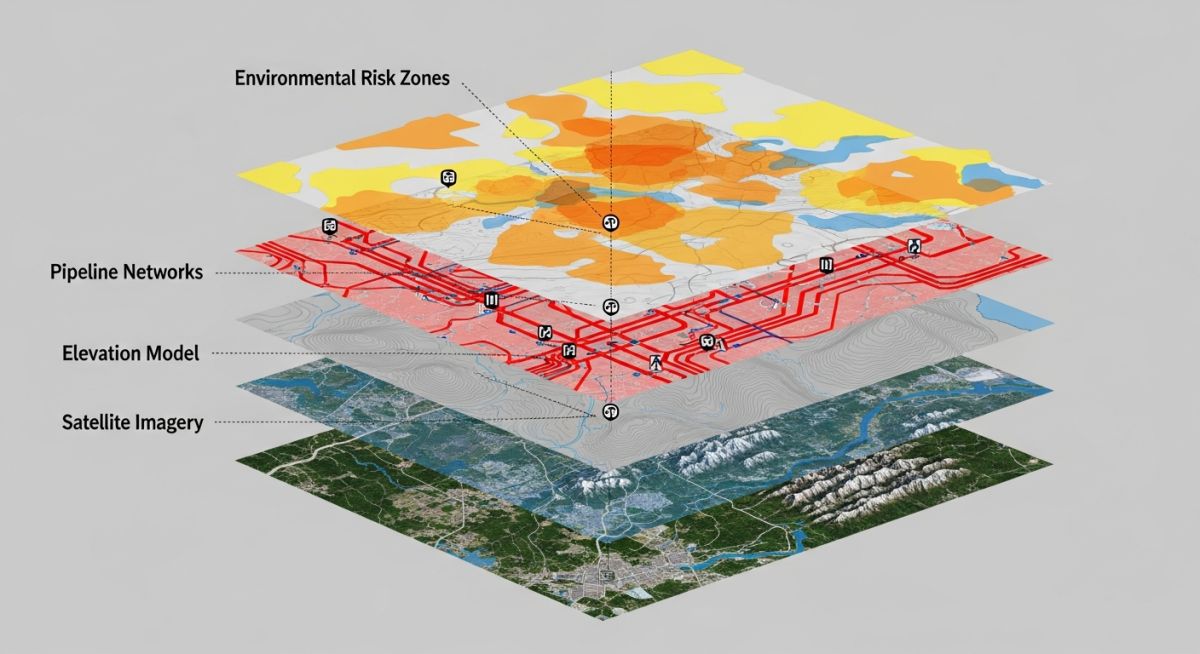
Another critical application is the identification of High Consequence Areas (HCAs) for gas transmission pipelines. Under ASME B31.8S, an HCA is defined based on the population density within a sliding mile corridor along the pipeline. GIS automates this process by buffering the pipeline centerline by the Potential Impact Radius (PIR) and overlaying building footprint data.
The PIR is calculated using the formula:
PIR = 0.69 * d * sqrt(P)
Where d is the nominal pipeline diameter in inches, and P is the maximum allowable operating pressure (MAOP) in pounds per square inch (psi). GIS dynamically recalculates this buffer whenever the pipeline diameter or MAOP changes, ensuring continuous regulatory compliance.
Value of GIS in Petroleum and Pipeline Industry
To effectively manage a pipeline network, engineers must understand the diverse data types integrated within a GIS platform. The table below outlines the primary spatial data layers, their engineering applications, and the governing standards.
| Data Layer | Data Source | Engineering Application | Relevant Standard |
|---|---|---|---|
| Pipeline Centerline | As-Built Surveys, RTK-GNSS | Asset tracking, alignment sheet generation, spatial reference. | ASME B31.4 / B31.8 |
| Digital Elevation Model (DEM) | LiDAR, Satellite Radar | Slope analysis, hydraulic modeling, landslide hazard mapping. | ASME B31.8S |
| High Consequence Areas (HCA) | Census Data, Satellite Imagery | Class location determination, integrity assessment scheduling. | 49 CFR Part 192 / 195 |
| Cathodic Protection (CP) Points | Field Test Stations, SCADA | Corrosion monitoring, anode bed location tracking. | NACE SP0169 |
| Environmental Constraints | Government Databases (USFWS) | Permitting, avoidance of wetlands and endangered species habitats. | NEPA Guidelines |
To ensure seamless data exchange between operators, contractors, and regulatory bodies, we rely on standardized data models. The Pipeline Open Data Standard (PODS) is the industry benchmark for structuring pipeline GIS databases.
| Entity / Acronym | Physical Parameter | Spatial Resolution | Reference Standard |
|---|---|---|---|
| PODS (Pipeline Open Data Standard) | Relational database schema for pipeline assets | Database Level (N/A) | PODS Association |
| ILI (In-Line Inspection) | Wall loss, cracks, dents, anomalies | Sub-decimeter (via GPS markers) | API RP 1163 |
| RTK-GNSS | Real-Time Kinematic Global Navigation Satellite System | 1 to 3 centimeters | USCG / NGS Standards |
| LiDAR (Light Detection and Ranging) | High-resolution elevation point clouds | 5 to 15 centimeters | USGS Lidar Base Spec |
Field Verification of Pipeline GIS Data
Before any pipeline is commissioned or backfilled, the field engineering team must verify the spatial accuracy of the GIS database. This process, known as ground-truthing, ensures that the digital twin matches the physical reality of the asset.
Pipeline GIS Field Verification Checklist:
-
Coordinate Reference System (CRS) Validation: Confirm that all field survey equipment is set to the project-specified CRS (e.g., NAD83 State Plane Zone) and that the correct geoid model is applied for elevation data.
-
Weld Map and Joint Tracking: Verify that every girth weld is georeferenced with sub-decimeter accuracy and linked to its corresponding pipe joint heat number and non-destructive testing (NDT) report.
-
Depth of Cover Verification: Record the top-of-pipe elevation and compare it to the natural ground surface elevation to ensure compliance with the minimum depth of cover requirements specified in ASME B31.4.
-
Appurtenance Georeferencing: Capture precise coordinates for all valves, tees, cathodic protection test stations, and casing ends.
-
Attribute Completeness Check: Ensure that all physical attributes (diameter, wall thickness, material grade, manufacturer, and coating type) are fully populated in the GIS database before final sign-off.
Field Case Study: Real-World Application
The Problem: Legacy Spatial Offsets and Pipeline Strikes
A major pipeline operator in the Permian Basin was experiencing frequent third-party pipeline strikes and regulatory compliance issues. The operator’s legacy database relied on scanned paper alignment sheets and historical CAD drawings, which had spatial offsets of up to 15 meters in some areas. During a routine excavation for a new gathering line, a contractor struck an existing 8-inch crude oil pipeline that was not accurately represented in the legacy system, resulting in a spill of 120 barrels and a temporary shutdown of the corridor.
The Outcome: Enterprise GIS and RTK Integration
The operator initiated a comprehensive spatial remediation project. I was brought in to oversee the integration of an enterprise GIS platform based on the PODS data model. We deployed field crews equipped with high-precision RTK-GNSS receivers to map all above-ground assets (valves, test stations, pig launchers) and used historical In-Line Inspection (ILI) run data to georeference the buried pipeline centerline.
By aligning the ILI inertial navigation system (INS) data with known surface GPS markers, we reduced the spatial uncertainty of the buried pipeline to under 15 centimeters. Over the next 24 months, the operator reported zero pipeline strikes, a 40% reduction in emergency response times, and full compliance with federal safety regulations, saving an estimated 4.2 million in potential liabilities and operational downtime.
This case study highlights a fundamental truth in pipeline engineering: your integrity management program is only as good as your spatial data. Investing in a robust GIS framework is not just about making maps; it is about protecting lives, assets, and the environment.
Frequently Asked Engineering Questions
How does GIS improve pipeline integrity management?
What coordinate reference systems are recommended for long-distance pipelines?
How does GIS integrate with SCADA systems for real-time monitoring?
What is the role of GIS in High Consequence Area (HCA) identification?
How does GIS assist in pipeline spill modeling and emergency response?
What are the data standards for pipeline GIS databases?
===
Complete Course on
Piping Engineering
Check Now
Key Features
- 125+ Hours Content
- 500+ Recorded Lectures
- 20+ Years Exp.
- Lifetime Access
Coverage
- Codes & Standards
- Layouts & Design
- Material Eng.
- Stress Analysis

📚 Recommended Resources: GIS in petroleum and pipeline industry
Read these Guides
Related posts:
![3D engineering diagram illustrating shear modulus deformation on a solid block with force vectors.]()
Understanding Shear Modulus and Modulus of Rigidity in Piping Design
![3D render of a protective chromium oxide film forming on a stainless steel surface.]()
How Does Stainless Steel Oxide Film Formation Prevent Corrosion?
![Side-by-side comparison of industrial metal casting and metal forging processes.]()
Casting vs Forging: Key Differences for Industrial Piping Systems
![Various types of industrial pumps displayed in a modern engineering facility.]()
Guide to Types of Pumps and Their Working Principles
![CAESAR II Version 14 pipe stress analysis software interface displaying a 3D piping model.]()
What Is New in CAESAR II Version 14 Pipe Stress Analysis
![Cutaway 3D render of an industrial multi-stage centrifugal compressor showing internal impellers and volute casing.]()
Centrifugal Compressors: Engineering Design Guidelines and Industrial Applications