Explore wind turbine fatigue failure mechanisms, S-N curves, and cumulative cyclic load analysis for 25-year structural design integrity per standards.
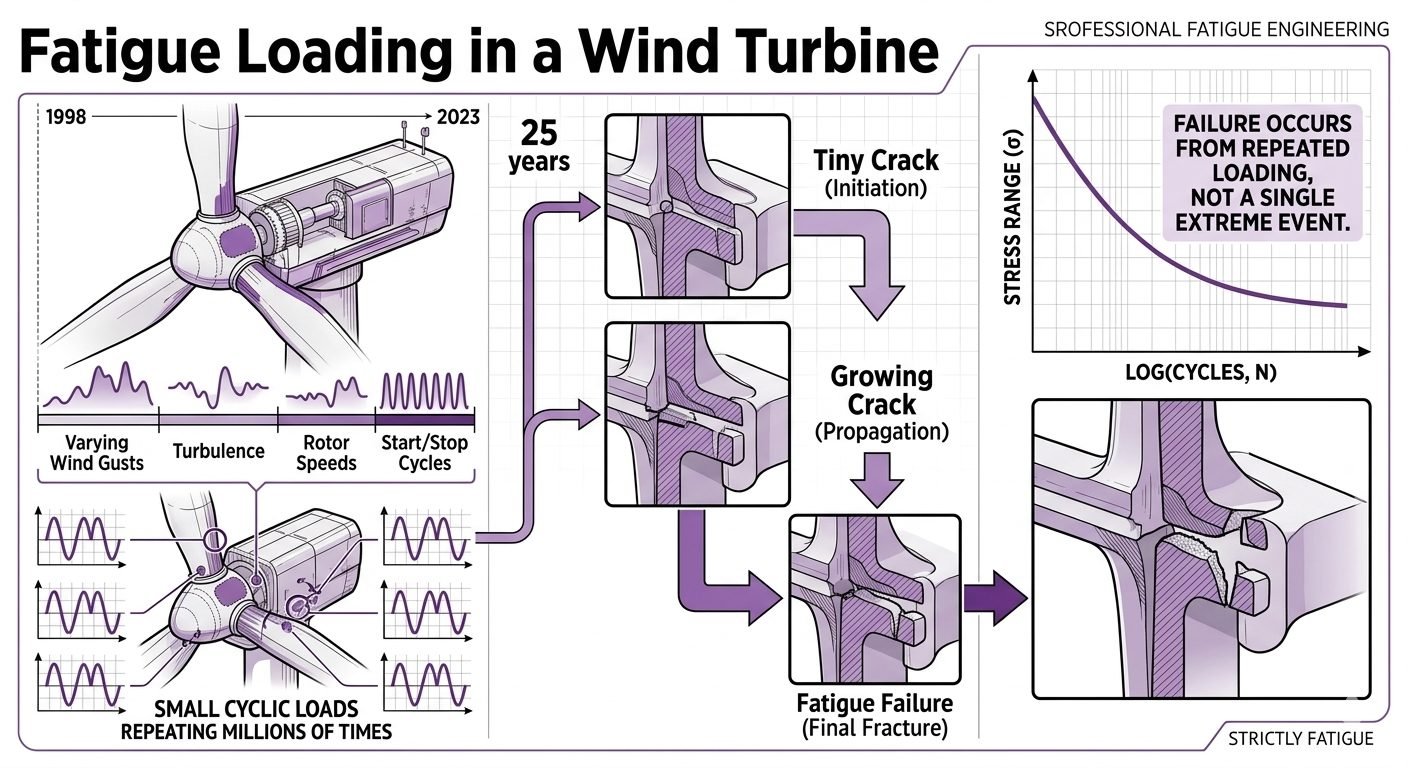
Explore wind turbine fatigue failure mechanisms, S-N curves, and cumulative cyclic load analysis for 25-year structural design integrity per standards.
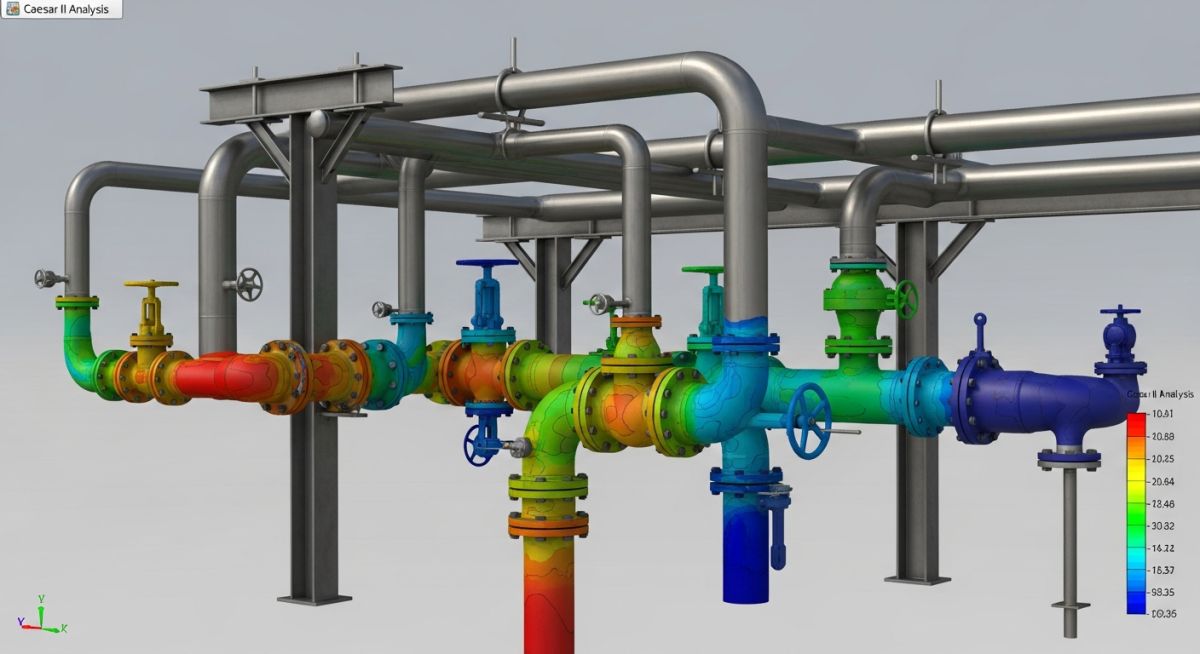
Master fatigue analysis: explore definitions, methods, failure criteria, and a practical Caesar II piping case study.