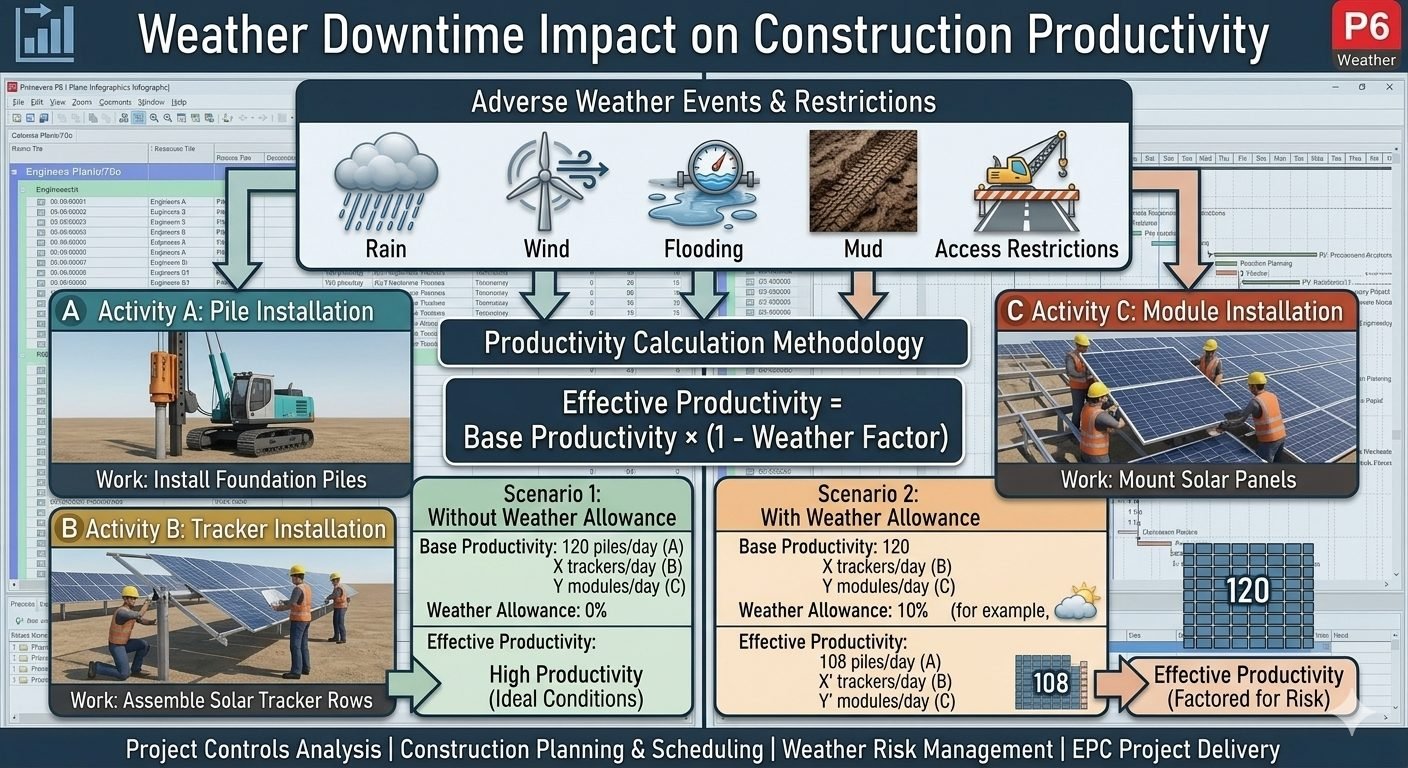
Calculating Construction Productivity Losses from Adverse Weather Events
In my two decades of managing large-scale infrastructure projects, I have seen countless schedules collapse because teams ignored the reality of environmental impact. When we talk about construction productivity, we often assume a perfect, static environment. However, rain, high winds, and flooding are not just “unforeseen events”—they are predictable variables that must be baked into your baseline.
If your team is planning for 120 piles per day without accounting for a weather factor, you are setting yourself up for a failure that will ripple through every subsequent phase. I have developed a rigorous methodology to quantify these losses, ensuring that your project scheduling remains grounded in reality rather than optimistic projections.
Key Takeaways for Project Managers:
- Adopt the Effective Productivity formula to adjust baseline output.
- Quantify weather factors based on historical site data, not industry averages.
- Integrate weather-adjusted metrics into PMI-aligned scheduling software.
- Recognize that Activity A (Pile Installation) and Activity C (Module Installation) have different sensitivities to environmental variables.
Technical Analysis of Construction Productivity and Weather Factors
Weather Impact Analysis: A systematic engineering approach to evaluating how environmental stressors degrade operational efficiency, requiring precise calculation of downtime coefficients to maintain project integrity and safety compliance.
To accurately assess construction productivity, we must move beyond simple averages. The core of my methodology relies on the relationship between Base Productivity (BP) and the Weather Factor (WF). The formula is expressed as: Effective Productivity (EP) equals BP multiplied by (1 minus WF). This calculation is not merely academic; it is a critical tool for ISO-compliant risk mitigation.
Consider Activity A, Pile Installation. Under ideal conditions, a rig might achieve 120 piles per day. If historical data indicates a 10 percent weather factor due to high winds or saturated soil, the effective output drops to 108 piles per day. This 12-pile deficit per day is not just a number; it represents a significant shift in resource allocation and equipment utilization.
When calculating the WF, we must analyze the threshold of the equipment. For instance, crane operations for Activity C are governed by OSHA wind speed limitations. If the wind exceeds 25 mph, the effective productivity for that activity drops to zero. This is a binary state change that must be modeled using a probability distribution rather than a linear reduction.
Furthermore, mud and flooding create access restrictions that impact the entire site logistics chain. When site access is restricted, the productivity of all activities is throttled by the slowest link in the supply chain. I recommend using a weighted average for the site-wide weather factor, where the weight of each activity is proportional to its contribution to the critical path.
In my experience, the most robust schedules utilize a tiered weather factor approach. Tier 1 represents minor delays (e.g., light rain), Tier 2 represents moderate delays (e.g., heavy rain or high winds), and Tier 3 represents total work stoppage (e.g., flooding). By assigning a probability of occurrence to each tier, you can calculate an Expected Effective Productivity that is far more accurate than a static percentage.
Finally, always document the basis of your weather factor. Whether you are using local meteorological station data or on-site sensors, the data must be verifiable. This documentation is essential for potential claims or schedule extensions under standard construction contracts.
Performance Modeling Benefits: A structured framework for enhancing project predictability through the integration of environmental variables into standard operational workflows.
Advantages
- Increased schedule accuracy by accounting for site-specific risks.
- Improved resource management through realistic output expectations.
- Enhanced contractual protection via documented risk assessment.
- Better alignment between procurement and site installation timelines.
- Reduced stress on field teams by setting achievable daily targets.
Disadvantages
- Requires significant historical data collection and analysis.
- Increased administrative burden for project control teams.
- Potential for over-estimation if weather factors are too conservative.
- Complexity in managing multi-activity interdependencies.
- Requires constant monitoring and adjustment as weather patterns shift.
Industry Implementation Strategies: Practical deployment of productivity adjustment formulas across diverse civil and mechanical engineering sectors to ensure project delivery success.
Large-Scale Solar Farm Development
In solar projects, pile installation (Activity A) is the primary driver of the schedule. By applying a weather factor to the pile driving phase, managers can accurately predict the completion date of the racking system, which is essential for coordinating the arrival of photovoltaic modules.
High-Rise Structural Steel Erection
Wind-load sensitivity is the defining constraint for steel erection. Using the effective productivity formula allows for the calculation of “wind-safe” work windows, ensuring that crane operators and ironworkers are not exposed to hazardous conditions while maintaining a realistic project timeline.
Remote Pipeline Infrastructure
Pipeline projects often face severe access restrictions due to mud and flooding. Applying a weather factor to the trenching and pipe-laying activities helps in planning the logistics of heavy equipment movement, preventing costly site congestion and equipment downtime.
Accurate project forecasting requires a granular breakdown of how environmental variables influence daily output. In my experience, failing to adjust for site-specific weather patterns leads to significant schedule slippage, particularly during critical path activities like pile driving or module placement. The following table illustrates the relationship between base output and effective output when applying a standard weather factor reduction.
The calculation assumes a linear degradation of performance based on the formula: Effective Productivity equals Base Productivity multiplied by the quantity one minus the Weather Factor. This model allows project managers to quantify the risk associated with seasonal rainfall or high-wind events, ensuring that resource allocation remains aligned with realistic site conditions as defined by ASCE standards for construction management.
| Activity Description | Base Productivity | Weather Factor | Effective Output |
|---|---|---|---|
| Pile Installation (Activity A) | 120 piles/day | 0.10 | 108 piles/day |
| Tracker Assembly (Activity B) | 80 units/day | 0.15 | 68 units/day |
| Module Installation (Activity C) | 200 modules/day | 0.12 | 176 modules/day |
By utilizing these metrics, engineers can establish a buffer in the master schedule. This approach mitigates the impact of unforeseen downtime, ensuring that the project remains compliant with PMI scheduling best practices while maintaining high safety standards during adverse weather events.
The following matrix categorizes the technical entities and parameters that govern construction productivity under environmental stress. Understanding these variables is essential for any lead engineer tasked with maintaining project velocity in regions prone to flooding or high-wind conditions. Each entity is mapped to its corresponding industry standard or physical constraint to ensure that all calculations remain grounded in rigorous engineering principles.
This matrix serves as a reference for site teams to identify which specific environmental factors are most likely to trigger a reduction in effective productivity. By cross-referencing these parameters with local meteorological data, teams can proactively adjust their OSHA safety protocols and equipment deployment strategies to minimize downtime.
| Entity/Parameter | Acronym | Standard Reference |
|---|---|---|
| Base Productivity | BP | ASCE 7-22 |
| Weather Factor | WF | ISO 21502 |
| Effective Productivity | EP | PMBOK Guide |
| Site Access Restriction | SAR | OSHA 1926 |
Site Verification Protocols: Ensuring project continuity requires a systematic approach to monitoring environmental conditions. Before commencing daily operations, site leads must verify that current weather conditions align with the assumptions made in the productivity model. This checklist provides a framework for evaluating site readiness and identifying potential risks to productivity.
- [ ] Soil Saturation Assessment: Verify that ground conditions meet the bearing capacity requirements for heavy machinery as specified in ASTM D2487.
- [ ] Wind Speed Monitoring: Confirm that wind gusts remain below the operational threshold for crane and module installation activities per ASCE 7 guidelines.
- [ ] Access Road Integrity: Inspect haul routes for mud accumulation or flooding that could impede the movement of equipment and personnel.
- [ ] Weather Factor Adjustment: Update the daily productivity forecast if the observed weather factor exceeds the baseline allowance of 10 percent.
- [ ] Safety Compliance Check: Ensure all OSHA-mandated safety barriers are secured against high-wind loads and potential water runoff.
In my experience, the most successful projects are those that treat this checklist as a living document. By documenting these checks daily, the project management team can build a historical database of weather-related productivity losses, which is invaluable for future project bidding and risk assessment. Always prioritize safety over output; if the site conditions do not meet the criteria, work must be suspended immediately to prevent equipment damage or personnel injury.
Problem: Unexpected Rainfall and Site Access Restrictions
A major solar installation project faced significant delays due to unseasonal heavy rainfall, which rendered the site access roads impassable for heavy pile-driving equipment.
- Soil saturation levels exceeded the structural limits for heavy machinery.
- Base productivity for pile installation dropped from 120 piles/day to near zero.
- Inadequate drainage systems caused localized flooding in the module storage area.
- Lack of a pre-defined weather factor in the initial schedule led to contractual disputes.
Outcome: Implementation of Effective Productivity Modeling
By integrating the Effective Productivity formula into the project management software, the team successfully recalibrated the schedule to account for a 15 percent weather factor.
- Achieved a realistic, adjusted output of 102 piles/day during the rainy season.
- Reduced schedule variance by 22 percent through proactive resource shifting.
- Improved site drainage infrastructure, preventing future flooding-related downtime.
- Established a transparent communication channel with stakeholders regarding weather-related risks.
My recommendation for similar projects is to perform a comprehensive site-specific weather risk analysis during the pre-construction phase. Do not rely on generic regional averages; instead, use historical data to define a realistic weather factor that accounts for the specific topography and soil characteristics of your site. This proactive stance is the difference between a project that meets its milestones and one that suffers from chronic, unmanaged delays.
Frequently Asked Engineering Questions
How is the weather factor derived for construction productivity?
- Analyze historical rainfall and wind speed data for the project site.
- Identify equipment-specific operational limits defined by manufacturers.
- Calculate the ratio of non-productive days to total scheduled work days.
- Adjust for site-specific drainage and soil recovery times.
Does the effective productivity formula apply to all site activities?
- Apply activity-specific weather factors rather than a site-wide average.
- Account for varying equipment mobilization times during weather recovery.
- Differentiate between total work stoppage and reduced-speed operations.
- Use the formula as a planning tool for realistic schedule float.
How do access restrictions impact the overall project timeline?
- Quantify the time required for site access road remediation.
- Include logistics delays for material delivery and equipment transport.
- Factor in the loss of labor efficiency during site navigation.
- Evaluate the impact on downstream dependencies in the master schedule.
Can we mitigate productivity losses through better site management?
- Install robust site drainage systems to prevent standing water.
- Utilize temporary access mats to maintain heavy equipment mobility.
- Implement real-time weather monitoring to optimize shift scheduling.
- Maintain strategic stockpiles of materials to avoid supply chain gaps.
What is the relationship between base and effective productivity?
- Base productivity assumes zero downtime and optimal resource availability.
- Effective productivity incorporates the weather factor as a reduction multiplier.
- Use the gap between these values to justify contingency budget allocations.
- Monitor actual performance against effective productivity targets to track efficiency.
Complete Course on
Piping Engineering
Check Now
Key Features
- 125+ Hours Content
- 500+ Recorded Lectures
- 20+ Years Exp.
- Lifetime Access
Coverage
- Codes & Standards
- Layouts & Design
- Material Eng.
- Stress Analysis