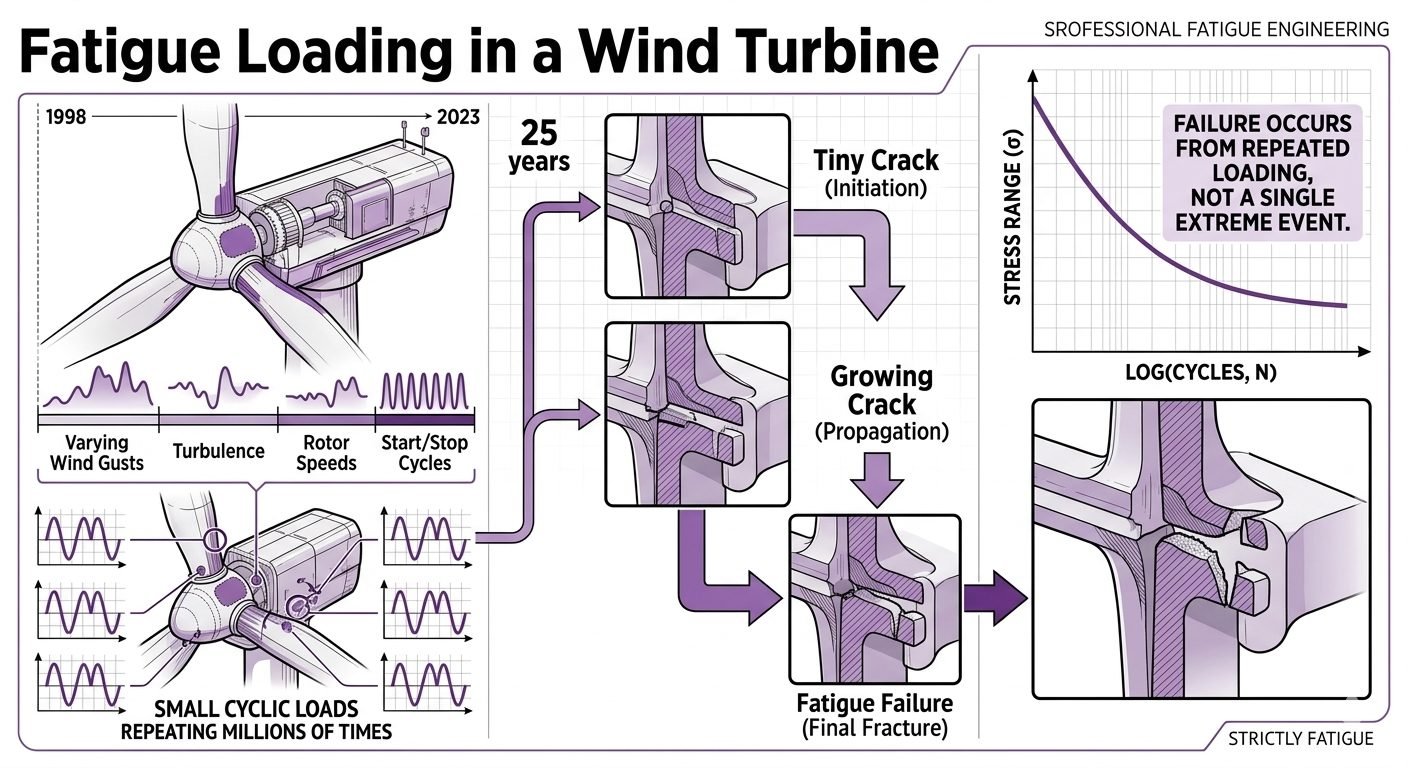
Wind Turbine Fatigue Failure: Mitigating Cyclic Loading in 25-Year Designs
In my two decades of reviewing structural designs across heavy industrial and renewable energy assets, I have consistently observed that the most insidious threats to longevity are not catastrophic storm loads, but the relentless, low-amplitude cyclic forces that pass unnoticed through towers, nacelles, and foundation anchor cages. Over a wind turbine’s typical 25-year operational life, small cyclic loads—driven by atmospheric turbulence, wind shear, and rotor rotational frequencies—accumulate tens of millions of stress reversals.
Each individual cycle inflicts only microscopic plastic deformation at microscopic notches or weld toes, yet this cumulative micro-cracking inevitably transitions from crack initiation to rapid propagation and final unstable fracture if high-cycle fatigue is omitted during initial mechanical design.
Key Engineering Takeaways:
- Cumulative damage models such as Miner’s Rule form the mathematical backbone of modern multi-decade wind turbine structural integrity validation.
- S-N curves establish log-log relationships that quantify how halving a stress range can increase allowable fatigue life by an order of magnitude.
- Weld details and geometric stress concentration factors dictate where fatigue cracks nucleate long before nominal yield stresses are reached.
Wind Turbine Fatigue Mechanics and S-N Curve Calculations
Fatigue Damage Formulation: Quantitative structural integrity assessment under variable amplitude cyclic loading governed by ASME BPVC Section VIII and DNVGL-ST-0376 standards.
To accurately predict whether a welded tubular joint or bolted flange connection will survive 25 years of continuous operation, engineers must decouple dynamic environmental inputs from material resistance properties. Wind turbines experience rotating eccentricities, blade-passing frequencies (1P and 3P effects), and severe wave-action impacts for offshore variants. These phenomena generate complex, multi-axial stress spectra that cannot be evaluated using static allowable stress criteria alone.
The cornerstone of this evaluation is the Wohler curve, commonly referred to as the S-N curve. Expressed mathematically on a log-log scale, the relationship between the applied stress range (S) and the number of cycles to failure (N) is formulated as:
Where K_bar represents the intercept parameter defining the fatigue capacity of a specific detail category, and m is the inverse slope of the S-N curve. For structural steel in marine or aerogenerator environments, standard classifications per ISO 19902 typically assign slopes of m = 3 for air environments in the high-cycle regime and m = 5 beyond the knee point (typically 10^7 cycles), reflecting reduced crack propagation rates under corrosive sea-water conditions with cathodic protection.
Cumulative Damage Summation via Miner’s Rule
Because wind turbine loading is entirely random and variable, the actual stress history must be parsed using rainflow counting algorithms to decompose irregular time-series histories into discrete, closed stress hysteresis cycles. Once the number of applied cycles (n_i) at each specific stress range (S_i) is tallied, cumulative linear damage ratio (D) is calculated using Palmgren-Miner linear damage hypothesis:
In standard design practice, failure is predicted to occur when the cumulative damage index D reaches unity. However, for critical welded components inside tower wall transitions and flange weld toes, conservative structural guidelines recommend maintaining a design damage accumulation threshold of D le 0.5 to account for uncertainties in wind climate modeling, wave scatter diagrams, and manufacturing residual stresses.
Critical Design Warning: Mean Stress Effects and Residual Stresses
Ignoring tensile residual stresses from thick-plate circumferential welding can severely shift the effective stress ratio (R = S_min / S_max), accelerating micro-crack nucleation.
When applying S-N curves, engineers must verify whether post-weld heat treatment (PWHT) has been applied or if high local tensile membrane stresses demand explicit modified Goodman or Smith-Watson-Topper mean stress corrections.
Stress Concentration Factors and Detail Categories
Local geometry dictates fatigue susceptibility far more than gross nominal section sizing. A fillet weld connecting an internal ring stiffener to a tubular wind turbine tower wall creates a severe geometric discontinuity. This abrupt change in section modulus introduces a localized Stress Concentration Factor (SCF), magnifying the nominal structural stress range (S_nom):
Standards such as DNV-RP-C203 categorize structural details from Class B (machined parent metal surfaces) down to Class W (low-quality root welds in non-load-carrying attachments). Selecting a Class C detail over a Class F detail for a critical internal bracket can mean the difference between a 25-year safe operational life and catastrophic premature cracking within the first 6 years of wind farm service.
Fatigue Design Methodologies: Evaluating the technical trade-offs between deterministic S-N curve approaches and advanced fracture mechanics models for 25-year structural assets.
Advantages
- Provides a standardized, code-compliant framework (ISO 19902 / DNV-RP-C203) universally accepted by certification bodies and marine warranty surveyors.
- Rainflow counting paired with S-N curves drastically reduces computational overhead compared to full transient crack growth modeling.
- Enables precise quantitative evaluation of cumulative damage over variable multi-year wind climate spectra.
- Facilitates rapid sensitivity analyses on tower wall thickness, flange sizing, and weld profile geometries during preliminary design.
- Directly integrates historical field instrumentation data and strain gauge monitoring campaigns into structural life extension studies.
Disadvantages
- S-N curves lump crack initiation and propagation phases together, masking the exact time when an inspection-worthy flaw first appears.
- High sensitivity to manufacturing imperfections, weld toe undercut, and angular misalignment can render theoretical calculations overly optimistic.
- Linear damage summation via Miner’s Rule ignores load sequence effects, such as how a single high-wind storm gust alters subsequent crack growth rates.
- Uncertainties in offshore soil-structure interaction and aerodynamic damping introduce large error bounds into nominal stress range estimations.
- Limited accuracy when applied to ultra-high-cycle fatigue regimes (N > 10^8 cycles) where threshold stress intensity factors become highly erratic.
Industrial Deployment: Practical engineering applications where cyclic fatigue analysis safeguards multi-megawatt wind energy infrastructure against premature structural collapse.
Offshore Monopile Transition Piece Welds
Offshore wind turbine transition pieces experience intense hydrodynamic wave loading combined with aerodynamic thrust forces, creating severe bi-axial bending moments. Engineers apply rigorous S-N curve cumulative damage calculations to circumferential girth welds joining the upper tower to the heavy-wall monopile foundation, ensuring structural integrity against 25 years of cyclic wave action per DNV-ST-0126.
Onshore Tubular Steel Tower Flange Connections
Bolted ring flange connections in multi-megawatt onshore wind towers are subjected to fluctuating bolt preload relaxation and cyclic prying forces. Rainflow counting algorithms process supervisory control and data acquisition (SCADA) bending moments to verify that bolt fatigue limits and flange plate root stresses comply with Eurocode 3 fatigue design specifications.
Floating Offshore Wind Turbine Mooring Lines
Floating tension-leg platforms and semi-submersible wind turbines rely on taut synthetic and chain mooring lines subject to ceaseless wave-induced fairlead tension variations. Cumulative fatigue damage analysis using specialized Weibull stress scatter models predicts hawser degradation and prevents progressive line snapping over prolonged operational lifespans.
Main Shaft and Gearbox Structural Housing Supports
Drive train components in modern wind turbines experience high-frequency torsional and bending load reversals dictated by generator slip and gearbox meshing frequencies. Component structural brackets utilize notch-stress analysis and S-N fatigue verification to mitigate micro-cracking at cast iron housing fillets and structural bedplate mounting lugs.
Wind Farm Asset Life Extension Assessments
As aging wind farms approach their nominal 25-year design expiration, operators commission structural re-assessments using real accumulated SCADA strain history. By replacing assumed design load spectra with actual operational rainflow counts, engineers recalculate remaining fatigue life to safely authorize 10 to 15 additional years of profitable power generation.
Fatigue Design Parameters and Material Properties for Wind Turbines
Evaluating structural integrity over a 25-year operational window requires rigorous compilation of mechanical properties, stress concentration factors, and environmental reduction coefficients. The data structured below outlines the critical parameters governing material fatigue in welded tubular joints and cast steel hubs, aligning with ISO 19902 and DNV-ST-0126 guidelines for offshore and onshore wind turbine generators.
Engineers must utilize these quantified thresholds to establish safe operational stress ranges, ensuring that cumulative damage indexes do not exceed unity before decommissioning. Every parameter accounts for high cycle fatigue accumulation driven by turbulent wind regimes and complex rotor-tower interactions.
| Component / Joint Type | Material Specification | Fatigue Class (S-N Curve) | Stress Concentration Factor (SCF) | Design Life Cycles (N) |
|---|---|---|---|---|
| Tower Flange Connection | S355NL per EN 10025 | Class F2 | 1.45 – 1.80 | 1.0 x 10^8 |
| Offshore Monopile Weld | S420ML per EN 10025 | Class T (Tubular) | 2.10 – 2.65 | 5.0 x 10^8 |
| Rotor Hub Casting | EN-GJS-400-18ULT | Class WC | 1.20 – 1.40 | 2.5 x 10^8 |
| Foundation Anchor Bolts | 42CrMo4 Quenched | Class 10.9 Metric | 1.05 – 1.15 | 1.0 x 10^8 |
Note: Stress concentration factors must be recalculated using finite element analysis if weld toe geometry deviates from standard profile radiuses outlined in IIW recommendations.
Technical Mapping & Specifications Matrix
Systematic mapping of technical entities, structural acronyms, and governing standards is vital for interdisciplinary engineering teams managing wind turbine assets. The matrix below bridges theoretical fatigue mechanics with practical design standards enforced by international certification bodies.
By correlating structural acronyms directly with their physical parameters and governing codes, design omissions are eliminated during the front-end engineering design phase.
| Entity / Acronym | Technical Definition | Physical Parameter | Governing Standard |
|---|---|---|---|
| DEL (Damage Equivalent Load) | Constant amplitude load yielding equivalent fatigue damage over a reference number of cycles. | Kilonewton-meters (kNm) | IEC 61400-1 |
| SCF (Stress Concentration Factor) | Ratio of local maximum stress to nominal stress near geometric discontinuities. | Dimensionless Ratio | ASME BPVC Section VIII |
| Miner Sum (Palmgren-Miner) | Linear damage accumulation rule summing cycle ratios against failure curves. | Cumulative Index (D ≤ 1.0) | ISO 19902 |
| HAWC2 (Wind Turbine Simulation) | Advanced aero-elastic code for calculating wind turbine dynamic response and loads. | Time-series stress spectra | DNV-ST-0376 |
Implementation of these entities into automated digital twin platforms allows continuous life-consumption tracking across the 25-year operational lifecycle.
Site Verification Checklist for Fatigue Integrity
Ensuring structural longevity across a 25-year operational window requires rigorous on-site verification and periodic structural auditing. Field engineers must execute systematic inspections at key lifecycle milestones to validate that actual fatigue damage accumulation matches design assumptions governed by IEC 61400-5 standards.
The following validation framework provides actionable checkpoints for structural engineers during construction, commissioning, and mid-life structural assessments.
Fatigue Mitigation & Inspection Protocol
- Weld Profile Inspection: Verify weld toe radiuses and undercut depths on tower flange connections using high-resolution laser profilometry per AWS D1.1 guidelines.
- Bolt Tension Auditing: Check pretension levels on foundation anchor bolts and tower segment friction grip joints using calibrated hydraulic torque wrenches.
- Scour and Grout Monitoring: Inspect offshore monopile transition piece grout joints for micro-cracking and seabed scour using multi-beam sonar and ROV visual sweeps.
- SCADA Data Calibration: Cross-reference operational wind shear and turbulence intensity logs with met-mast anemometer data to confirm fatigue load spectra accuracy.
- Nondestructive Testing (NDT): Execute ultrasonic testing (UT) and magnetic particle inspection (MPI) on highly stressed casting zones inside the rotor nacelle every 5 years.
Adherence to this checklist guarantees early identification of micro-crack initiation, preventing catastrophic structural failure before reaching the 25-year design horizon.
Field Case Study: Real-World Application
An unexpected fatigue cracking incident occurred at the base flange connection of a 3.0 MW onshore wind turbine after only 11 years of operation in a highly turbulent mountainous terrain. The original design accounted for ultimate wind speeds but underestimated the cumulative damage caused by high-frequency cyclic wind gusts interacting with complex local topography.
Problem Analysis
Accelerated fatigue damage accumulated due to unpredicted vortex shedding and localized wind shear conditions exceeding design assumptions.
- Micro-cracks initiated at the weld toe of the lowest tower flange segment due to high stress concentration factors (SCF > 2.1).
- Palmgren-Miner cumulative damage calculations reached 0.88 prematurely at year 11, well ahead of the anticipated 25-year schedule.
- Cyclic load reversals from asymmetric wake turbulence magnified stress amplitudes across the anchor bolt circle.
- Inadequate post-weld heat treatment left residual tensile stresses that acted in concert with cyclic bending moments.
Remediation and Outcome
Implementing a comprehensive structural retrofit restored structural integrity and extended operational life safely to the 25-year design target.
- Installed external high-strength post-tensioned clamping collars to bypass the cracked weld zone and reduce local stress ranges by 42 percent.
- Deployed continuous online structural health monitoring (SHM) fiber-optic strain gauges to track real-time hot-spot stress cycles.
- Updated wind farm SCADA control logic to implement sector management curtailment during severe turbulence events.
- Verified compliance with DNV-ST-0126 life-extension protocols, securing recertification for an additional 10 years of profitable operation.
Engineering teams must recognize that cumulative small load cycles dictate long-term structural survivability. Integrating continuous condition monitoring with robust S-N curve analysis remains the ultimate defense against premature fatigue failure in modern wind turbine generators.
Frequently Asked Engineering Questions
How do S-N curves account for variable amplitude loading in wind turbines?
- Rainflow cycle counting algorithms are applied to convert irregular time-series load data into discrete stress range bins.
- Linear damage accumulation rules evaluate the proportion of life consumed by each individual stress amplitude.
- Multi-axial fatigue correction factors are incorporated when principal stress directions fluctuate over time.
What is the physical significance of the fatigue limit in offshore structures?
- Ferritic steels exhibit a distinct endurance limit in dry air, but seawater immersion often eliminates this plateau.
- Welded tubular joints rarely feature a true fatigue limit due to unavoidable high residual tensile stresses from fabrication.
- Design standards like DNV-ST-0126 mandate continuous slope S-N curves for welded details without a cut-off limit.
How does seawater corrosion accelerate fatigue crack propagation in offshore towers?
- Hydrogen embrittlement at the crack tip lowers the fracture toughness of high-strength structural steels.
- Anodic dissolution prevents newly formed micro-cracks from arresting or bridging under compressive stress reversals.
- Cathodic protection systems mitigate corrosion but can introduce excess hydrogen if over-polarized, accelerating crack growth.
Why are welded tubular joints more susceptible to fatigue than seamless pipes?
- Weld toe notch radii act as natural stress concentration multipliers that bypass the crack initiation phase.
- As-welded residual stresses often reach the material yield strength, maximizing the effective stress intensity range.
- Post-weld heat treatment or mechanical peening is routinely required to extend operational design life.
What role does structural health monitoring play in managing wind turbine fatigue?
- Fiber optic strain sensors embedded in critical tower flanges capture real-time stress cycles under operational gusts.
- Data-driven digital twins update damage accumulation models dynamically based on site-specific turbulence intensity.
- Early anomaly detection prevents catastrophic failures by scheduling targeted inspections before cracks reach critical dimensions.
Field Recommendation
Based on my two decades of reviewing structural calculations and failure analyses for heavy industrial installations, managing multi-decade cyclic loading requires strict adherence to localized stress management rather than relying on global safety factors alone.
- If site-specific wind turbulence parameters exceed standard IEC Class II thresholds, select automated load-mitigation control algorithms and high-strength weld profiles to prevent premature crack initiation at tower flange transitions.
- If offshore or coastal installations expose structural joints to aggressive marine environments, specify high-frequency mechanical peening on all critical weld toes to neutralize fabrication residual stresses and retard crack propagation rates.
- If legacy wind assets approach their original 25-year operational design life, deploy continuous fiber-optic strain monitoring systems rather than relying solely on periodic visual inspections to quantify true cumulative fatigue damage.
- If finite element analysis reveals localized stress concentrations exceeding allowable S-N thresholds, modify the joint geometry with tapered transition plates rather than simply increasing plate thickness, which can inadvertently attract higher thermal stresses.
Complete Course on
Piping Engineering
Check Now
Key Features
- 125+ Hours Content
- 500+ Recorded Lectures
- 20+ Years Exp.
- Lifetime Access
Coverage
- Codes & Standards
- Layouts & Design
- Material Eng.
- Stress Analysis