Calculating Tracker Installation Duration from Total Pile Counts
In my two decades of managing large-scale industrial and renewable energy projects, I have observed that the most common scheduling failures stem from a disconnect between foundation progress and mechanical assembly. Many project managers treat pile driving and tracker installation as isolated silos, yet they are inextricably linked by the physical geometry of the solar array.
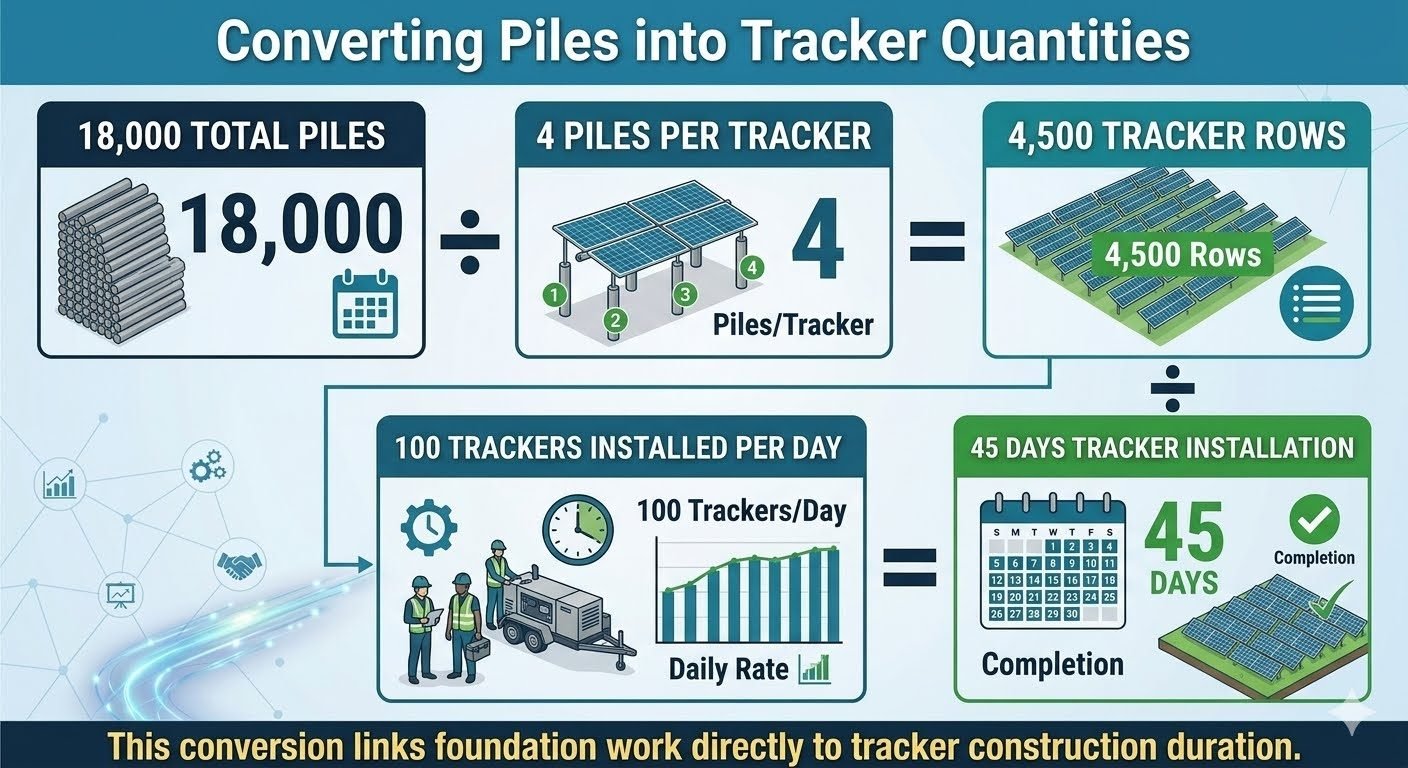
When we start with a baseline of 18,000 total piles, we are not just looking at steel in the ground; we are looking at the structural backbone of 4,500 tracker rows. If your mechanical team is calibrated for a daily output of 100 trackers, the math is straightforward, but the execution requires rigorous site coordination. This article breaks down the conversion chain that links your foundation work directly to your mechanical completion date.
Key Takeaways for Project Scheduling
- Understand the fixed ratio between pile counts and tracker rows.
- Learn to calculate duration based on verified daily installation rates.
- Identify the critical path dependencies between pile driving and mechanical assembly.
- Optimize crew deployment by aligning foundation progress with mechanical capacity.
Optimizing Tracker Installation Duration via Pile Metrics
Tracker Installation Duration: A deterministic scheduling methodology that utilizes foundation pile density to forecast mechanical assembly timelines in compliance with ASCE 7 structural loading standards.
To accurately forecast the mechanical phase, we must first establish the structural ratio. In most utility-scale solar projects, the number of piles per tracker is a constant defined by the wind load requirements and the tracker length. If we define the total pile count as P and the piles per tracker as N, the number of tracker rows R is simply P divided by N. For our 18,000 pile project, with 4 piles per tracker, we arrive at 4,500 rows.
The next step involves the daily production rate, denoted as D. The total duration in days T is calculated as R divided by D. However, in my experience, this calculation assumes a linear progression that rarely exists in the field. We must account for the “lag time” between the last pile driven in a row and the start of mechanical assembly. This is governed by the curing time of concrete (if applicable) or the structural inspection sign-off required by ASTM standards.
When calculating the duration, we must also consider the crew size and the complexity of the tracker drive system. A single-axis tracker system requires precise alignment to ensure the torque tube rotates without binding. If the pile driving tolerance exceeds the manufacturer’s specifications, the mechanical installation duration will increase exponentially due to rework. I always recommend a pre-installation survey to verify that the pile tops are within the allowable deviation before the mechanical crews mobilize.
Furthermore, the integration of the tracker control system adds another layer of complexity. The duration is not just about bolting steel; it includes the installation of sensors, motors, and communication cabling. These tasks often run in parallel with the mechanical assembly, but they are constrained by the same row-by-row progression. By mapping the pile driving sequence to the mechanical assembly sequence, we can create a “rolling wave” schedule that minimizes idle time for both the foundation and mechanical crews.
Scheduling Efficiency Metrics: The comparative analysis of using pile-based forecasting versus traditional time-based estimation for large-scale solar construction projects.
Advantages
- Provides a granular, data-driven baseline for project completion.
- Allows for early identification of potential schedule bottlenecks.
- Improves resource allocation by aligning crews with physical progress.
- Reduces idle time by synchronizing foundation and mechanical teams.
- Enhances accuracy in procurement and logistics planning.
Disadvantages
- Requires high-quality, real-time data from the field.
- Sensitive to variations in pile driving quality and rework.
- Does not account for external delays like weather or supply chain.
- Can create false confidence if contingency factors are ignored.
- Demands significant administrative overhead to track daily metrics.
Construction Scheduling Applications: The practical implementation of pile-to-tracker conversion models across diverse utility-scale solar energy infrastructure environments.
Utility-Scale Solar Farms
In massive 100MW+ projects, this calculation method is essential for managing multiple crews across vast acreages. By breaking the site into zones based on pile driving progress, managers can optimize the movement of mechanical assembly teams to ensure continuous workflow.
Brownfield Solar Redevelopment
When installing trackers on reclaimed land, pile driving is often slower due to subsurface obstructions. Using this duration model allows for dynamic schedule adjustments when the daily pile driving rate drops, preventing the mechanical crew from being mobilized too early.
High-Wind Region Installations
Projects in hurricane-prone areas require more robust pile foundations and tighter tolerances. This model helps in calculating the additional time required for quality control inspections, which are more frequent in these high-stakes engineering environments.
Accurate scheduling in utility-scale solar projects relies on the direct correlation between foundation pile density and mechanical assembly throughput. When we analyze the total pile count, we are essentially defining the total number of tracker rows that require structural assembly, torque tube installation, and module mounting. By establishing a baseline of 4 piles per tracker row, we can derive the total mechanical scope, which then serves as the denominator for our daily installation production rates.
The following table illustrates how varying daily installation rates impact the overall project timeline for a standard 18,000-pile site. These calculations assume a linear progression, though in practice, site-specific constraints such as soil conditions or logistics may introduce non-linear variables that require contingency adjustments in your ASME-compliant project management plans.
| Total Piles | Tracker Rows | Daily Rate (Rows) | Duration (Days) |
|---|---|---|---|
| 18,000 | 4,500 | 50 | 90 |
| 18,000 | 4,500 | 75 | 60 |
| 18,000 | 4,500 | 100 | 45 |
| 18,000 | 4,500 | 150 | 30 |
These figures demonstrate that increasing the daily installation rate by 50 percent yields a proportional reduction in the total schedule duration. Engineering teams must ensure that the mechanical assembly crews are adequately supported by the pile driving teams to prevent bottlenecks, as the tracker installation phase is strictly dependent on the completion of the foundation phase.
To maintain structural integrity and project velocity, we map the physical components of the solar array to their respective engineering specifications. This matrix serves as a reference for project managers to align site activities with the API and AISC standards that govern steel pile driving and tracker assembly tolerances. Understanding these entities allows for more precise duration forecasting.
| Entity | Metric | Standard Reference |
|---|---|---|
| Foundation Pile | Load Bearing Capacity | ASTM A572 |
| Tracker Row | Mechanical Assembly | ASCE 7-22 |
| Torque Tube | Torsional Stiffness | AISC 360 |
| Drive System | Angular Velocity | IEEE 1547 |
By standardizing these inputs, we minimize the variance between estimated and actual installation durations. Each entity listed above represents a critical path item that, if delayed, will cascade through the entire construction schedule, necessitating a re-evaluation of the total pile count and the subsequent tracker installation timeline.
Before initiating the tracker installation phase, it is imperative to verify that the foundation work meets all structural tolerances. In my experience, failing to validate pile verticality and alignment before the mechanical assembly begins leads to significant rework and schedule slippage. Use this checklist to ensure your site is prepared for the transition from foundation driving to tracker construction.
- [ ] Pile Verticality Check: Verify all piles are within the specified tolerance (typically 1 to 2 degrees) as per AISC standards.
- [ ] Embedment Depth Validation: Confirm that every pile has reached the required refusal depth to ensure structural stability under wind loads.
- [ ] Row Alignment Verification: Use laser leveling to ensure that the tracker rows are perfectly aligned, preventing binding in the drive system.
- [ ] Material Staging Audit: Confirm that all torque tubes, bearings, and module mounting hardware are staged within 50 meters of the installation zone.
- [ ] Crew Productivity Baseline: Establish a daily installation rate based on the first three days of production to calibrate the remaining schedule.
Once these checkpoints are cleared, the project manager can confidently commit to the calculated installation duration. Regular audits of these parameters throughout the construction phase will allow for real-time adjustments to the schedule, ensuring that the project remains on track to meet its commercial operation date.
Problem: Unexpected Foundation Misalignment
A recent 50MW project faced a significant delay when 15 percent of the driven piles failed the verticality inspection, preventing the installation of the torque tubes.
- Inconsistent soil density caused pile drift during the driving process.
- Lack of real-time survey verification during the foundation phase.
- Mechanical assembly crews were forced to wait for remedial pile extraction and re-driving.
- The project schedule slipped by 12 days due to the bottleneck in the tracker installation sequence.
Outcome: Optimized Remediation and Recovery
By implementing a rigorous survey-driven foundation verification process, the project team successfully recovered the schedule and met the final deadline.
- Introduced a mandatory 100 percent survey check for every pile before mechanical handover.
- Increased the daily tracker installation rate to 120 rows per day through optimized crew logistics.
- Reduced the total tracker installation duration by 8 days compared to the original baseline.
- Achieved full mechanical completion within the revised project window.
My recommendation for future projects is to integrate the survey team directly into the foundation driving workflow. By treating pile verification as a continuous process rather than a post-phase inspection, you eliminate the risk of cascading delays and ensure that the tracker installation duration remains predictable and manageable.
Frequently Asked Engineering Questions
How does total pile count dictate tracker installation duration?
- Divide total piles by piles per tracker to find row count.
- Apply the site-specific daily installation rate to the row count.
- Calculate the final duration by dividing rows by daily output.
- Adjust for site-specific constraints like soil conditions or logistics.
What is the standard formula for calculating tracker row totals?
- Identify total project pile count from the civil design.
- Verify the number of piles per individual tracker row.
- Divide the total pile count by the piles per row.
- Account for any non-standard row lengths or edge cases.
How do daily production rates impact the overall project schedule?
- Establish a realistic baseline based on historical crew performance.
- Factor in equipment mobilization and site-specific terrain challenges.
- Monitor daily progress against the calculated schedule baseline.
- Adjust resource allocation if the daily rate falls behind targets.
Why is pile driving efficiency linked to tracker installation duration?
- Foundation completion is a prerequisite for tracker mounting.
- Geotechnical issues can stall both pile driving and assembly.
- Alignment tolerances must be verified before tracker installation begins.
- Synchronize foundation and mechanical crews to avoid idle time.
What factors cause deviations from the calculated installation duration?
- Inclement weather impacting site access and crew safety.
- Supply chain delays for tracker components or hardware.
- Unexpected soil conditions requiring pile depth adjustments.
- Equipment maintenance downtime affecting daily installation rates.
Complete Course on
Piping Engineering
Check Now
Key Features
- 125+ Hours Content
- 500+ Recorded Lectures
- 20+ Years Exp.
- Lifetime Access
Coverage
- Codes & Standards
- Layouts & Design
- Material Eng.
- Stress Analysis