Solar Construction Flow Optimizer: Modeling Piling to COD
In my experience managing utility-scale photovoltaic projects across challenging terrain, I have seen far too many schedules fail because estimators treat piling as an isolated activity. When you design a 500-megawatt solar farm, the foundation installation pace does not dictate the final Commercial Operation Date on its own; rather, it sets off a cascading sequence of downstream dependencies. A delay in driving driven piles or installing helical anchors ripples directly into torque tube assembly, module mounting, cabling, mechanical completion, and eventually energization.
To eliminate these blind spots, I rely on a robust Solar Construction Flow Optimizer. This sophisticated modeling engine captures the intricate interplay between multiple parallel execution streams, such as structural steel erection and photovoltaic module deployment. By mathematically linking foundation quantities to crew productivity metrics, the optimizer replaces static Gantt charts with dynamic, constraint-aware forecasting that protects your project baseline.
Key Engineering Takeaways
- Integrates total foundation counts directly with tracker row geometry to calculate precise component quantities.
- Models dual installation paths concurrently, balancing structural mechanical crews with electrical module mounting teams.
- Directly links mechanical completion milestones with grid interconnection milestones to prevent site congestion and demobilization loops.
Solar Construction Flow Optimizer Architecture and Mechanics
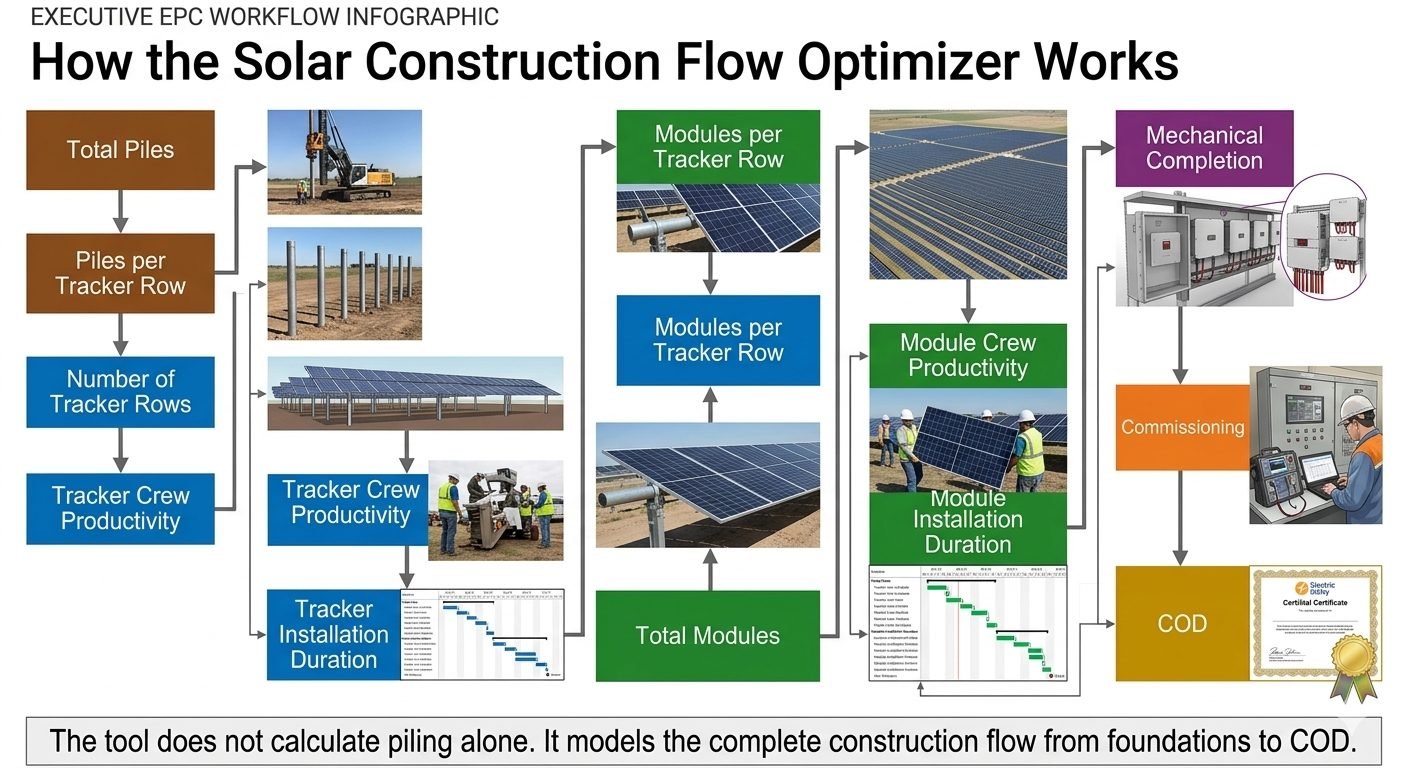
Building an effective construction flow model requires breaking down the utility-scale solar farm into its fundamental mathematical relationships. At the core of the optimizer is the conversion of raw site capacity into discrete structural entities. Starting from the total pile count derived from geotechnical reports and structural wind tunnel tests under ASCE 7 guidelines, the tool computes the exact structural hierarchy.
The first major calculation step determines the number of piles per tracker row. By dividing the Total Piles by this row factor, the algorithm establishes the precise Number of Tracker Rows. This derivation is critical because every tracker row acts as a discrete work package on site. Once the total tracker row count is established, multiplying it by the tracker crew productivity rate yields the total Tracker Installation Duration.
Concurrently, the model evaluates the electrical and module mounting side of the construction equation. The Modules per Tracker Row parameter combines with the Number of Tracker Rows to determine the Total Modules required for the plant. This quantity is then processed alongside the module crew productivity rate to calculate the Module Installation Duration stream.
Core Calculation Workflow Equations
- Tracker Rows: Total Piles / Piles per Tracker Row = Number of Tracker Rows
- Mechanical Duration: Number of Tracker Rows / Daily Tracker Crew Production Rate = Tracker Installation Duration
- Total Modules: Number of Tracker Rows * Modules per Tracker Row = Total Module Count
- Electrical Duration: Total Module Count / Daily Module Crew Production Rate = Module Installation Duration
One of the most valuable aspects of this modeling approach is its handling of concurrency and lag relationships. In traditional scheduling, estimators often assume module installation can start immediately after the first pile is driven. However, in reality, structural quality control inspections, torque verification of foundation bolts, and slew gear alignment create necessary curing or inspection buffers.
The optimizer incorporates these buffer constraints by defining handoff zones between the heavy civil/piling crews and the precision mechanical assembly crews. If piling production outpaces torque tube installation, front-end congestion occurs, leading to restricted equipment access and staging yard gridlock. Conversely, if mechanical crews outpace piling, costly crew idle time and demobilization penalties ensue.
Engineering Warning: Piling Outpace Risks
Allowing pile driving to advance more than 30 percent ahead of tracker assembly creates severe logistical friction on site. Uninstalled piles protruding from the ground prevent heavy machinery from traversing rows safely, forcing inefficient detours and increasing the risk of equipment strikes against driven profiles.
As both the mechanical tracker installation stream and the electrical module installation stream progress, their convergence points dictate the timing of Mechanical Completion. Mechanical Completion is not merely a paperwork milestone; it is the rigorous verification that every torque tube, gear motor, string inverter, and DC home-run cable has been installed, inspected, and tested per NFPA 70 National Electrical Code standards.
Following Mechanical Completion, the model transitions into the Commissioning phase. Commissioning encompasses insulation resistance testing, IV curve tracing, string polarity checks, and tracker controller commissioning. The duration of this phase is governed by utility-specific interconnection requirements and grid code compliance mandated by bodies like NERC.
Finally, the construction flow model culminates in the Commercial Operation Date. By simulating every prerequisite step—from the first ram stroke of the pile driver to the final substation backfeed and performance test—the optimizer provides project executives with a defensible, highly accurate probability distribution of when revenue generation will officially begin.
Advantages
- Replaces subjective estimating guesses with data-driven production rates derived from historical site logs.
- Explicitly captures interdependencies between civil piling, mechanical erection, and electrical wiring.
- Identifies potential resource bottlenecks weeks before they impact the critical path schedule.
- Improves subcontractor resource leveling by smoothing daily equipment and manpower demands.
- Provides defensible schedule delay claims documentation when weather or supply chain disruptions occur.
Disadvantages
- Requires extensive upfront data gathering regarding geotechnical profiles and accurate crew output metrics.
- Demands specialized scheduling expertise to configure and maintain the parametric calculation logic.
- Can create false confidence if baseline productivity inputs are not regularly calibrated against actual field output.
- Initial software setup and integration with existing enterprise resource planning systems can be time-consuming.
- Resistant field teams may struggle to adapt their daily tracking habits to feed the optimizer’s data requirements.
Utility-Scale Desert Megaprojects
In arid, expansive desert installations exceeding 500 megawatts, maintaining uniform high-speed pile driving is critical due to favorable soil conditions. The flow optimizer models multiple concurrent piling spreads operating miles apart, ensuring that tracker assembly and module mounting crews remain continuously supplied with ready foundations without overwhelming site laydown yards.
Undulating Terrain and Sloped Sites
Sites featuring rolling hills and variable bedrock depths require complex geotechnical adjustments where pile driving rates drop significantly. The optimizer dynamically scales crew productivity factors based on slope gradients and refusal rates, recalculating the downstream impact on mechanical completion and preventing unrealistic scheduling assumptions.
Brownfield and Landfill Solar Redevelopment
Redeveloping capped landfills or industrial brownfields introduces stringent limitations regarding ballast blocks, surface penetration depth, and settlement monitoring. The flow optimizer incorporates specialized non-penetrating or shallow ballasted foundation metrics, accurately forecasting installation pacing under strict environmental protection protocols.
Agrivoltaics and Dual-Use Installations
Agricultural solar projects featuring elevated tracker mounting structures and specialized spacing for crop cultivation require unique construction sequencing. The optimizer models dual work streams where tracker installation must coordinate closely with ongoing agricultural preparation and specialized clearance equipment maneuvers.
Solar Construction Flow Parameters and Optimization Metrics
To accurately forecast utility-scale photovoltaic deployment schedules, project engineers must utilize quantitative parametric metrics that link foundational driving rates directly to final grid synchronization. A solar construction flow optimizer bridges the gap between discrete site activities by establishing mathematical dependencies across the entire supply chain. In my experience managing multi-megawatt installations, calculating piling productivity independently of tracker assembly and module mounting inevitably leads to severe bottlenecking, false critical paths, and costly crew standstills.
The structured engineering reference table below outlines the core calculation variables, standard industry baselines, and governing formulas utilized within an integrated construction flow model. These parameters comply with ASME project management guidelines and structural installation tolerances established by major tracker manufacturers such as NEXTracker and Array Technologies. Each parameter feeds sequentially into downstream productivity equations, ensuring that schedule compression efforts in one discipline do not outpace material logistics or preceding structural completion thresholds.
| Parameter Name | Mathematical Symbol | Typical Baseline Value | Governing Formula / Dependency |
|---|---|---|---|
| Total Piles Required | N_p | 3,200 piles / MWdc | Total Capacity (MWdc) * Specific Pile Density |
| Piles Per Tracker Row | P_tr | 24 to 30 piles / row | Row Length / Pile Span + End Piles |
| Number of Tracker Rows | N_tr | Derived variable | N_p / P_tr (Total Piles / Piles per Row) |
| Tracker Crew Productivity | CP_trk | 8 to 12 rows / crew-day | Empirical field rate adjusted for soil and weather |
| Tracker Installation Duration | D_trk | Calculated span | N_tr / (CP_trk * Active Crews) |
| Total PV Modules | N_mod | 1,850 modules / MWdc | N_tr * Modules per Tracker Row |
| Module Crew Productivity | CP_mod | 450 to 600 modules / crew-day | Table mount rate via torque-tube clamping teams |
| Module Installation Duration | D_mod | Calculated span | N_mod / (CP_mod * Active Module Crews) |
Note: Baseline productivity figures assume level terrain, standard geotechnical conditions without pre-drilling requirements, and uninterrupted module delivery sequencing from staging yards.
Technical Mapping & Specifications Matrix
Integrating discrete engineering disciplines requires a rigorous data matrix that maps structural components, electrical subsystems, and civil milestones into a unified taxonomy. Within an advanced solar construction flow optimizer, each entity carries specific physical attributes, installation constraints, and quality verification gates. This matrix prevents scope gaps between civil execution teams, mechanical erectors, and electrical wiring crews.
The structured entity matrix below correlates structural acronyms, physical parameters, code compliance references, and dependent construction activities. By maintaining strict digital tracking of these entities through ISO quality management frameworks, project managers eliminate downstream rework during mechanical completion inspections and high-voltage grid commissioning phases.
| Entity Category | Structural Acronym | Physical Parameter | Governing Standard / Code | Downstream Dependency |
|---|---|---|---|---|
| Foundation Piling | PIL | Embedment Depth & Pull-Out Resistance | ASTM D3689 Load Testing | Tracker Slewing & Bearing Alignment |
| Tracker Torque Tube | TRK | Torsional Rigidity & Deflection Limit | ASCE 7-22 Wind Loading | Module Clamping & DC Home Run Cabling |
| PV Module Mounting | MOD | Tilt Angle Accuracy & Torque Spec | IEC 61215 Mechanical Load | String Inverter Home Run Termination |
| Mechanical Completion | MC | 100 percent Subsystem Sign-Off | IEEE 1547 Interconnection | Pre-Commissioning Insulation Testing |
| Commercial Operation | COD | Grid Synchronization & Performance Ratio | FERC / Utility PPA Milestones | Asset Transfer & Warranty Commencement |
Mapping these entities into a single flow model ensures that resource leveling algorithms account for multi-craft dependencies across civil, mechanical, and electrical scopes.
Site Verification Checklist for Construction Flow Optimization
Executing an integrated utility-scale solar construction schedule requires rigorous stage-gate verification to confirm that preceding trade packages meet exact engineering tolerances before downstream crews mobilize. When utilizing a solar construction flow optimizer, field superintendents must validate physical installation milestones against modeled baseline assumptions daily. In my field experience, failing to catch foundation misalignment or torque tube camber deviations early compounds exponentially during subsequent module mounting and electrical wiring phases.
The structured checklist below establishes mandatory verification checkpoints across the entire construction sequence, from initial geotechnical pile driving all the way through to mechanical completion and grid COD. Each item incorporates governing quality standards from organizations such as ASCE and IEEE to protect project commercial viability.
Utility-Scale Construction Flow Verification Protocol
- Geotechnical & Piling Verification: Confirm that pull-out load testing conforms to ASTM D3689 specifications and that driven pile plumbness remains within plus or minus 0.5 degrees across all tracker rows.
- Piles per Tracker Row Audit: Verify that installed pile counts match model inputs (P_tr), ensuring row length geometry accommodates specified torque tube spans without excessive cantilever stress.
- Tracker Crew Productivity Tracking: Monitor daily erected rows against model baseline (CP_trk). If productivity dips below 85 percent for three consecutive days, trigger resource re-allocation protocols.
- Torque Tube & Slew Drive Alignment: Check rotational alignment and bearing torque tolerances per manufacturer installation manuals prior to releasing areas for PV module mounting crews.
- Module Installation Quality Gate: Verify module clamp torque values using calibrated tools and ensure zero micro-cracking occurs during handling across high-wind storage sectors.
- Mechanical Completion (MC) Sign-Off: Confirm 100 percent structural assembly, torque verification, and initial string insulation testing before handing over subsystems to commissioning engineers.
- Commercial Operation Date (COD) Readiness: Validate all utility interconnection requirements, SCADA telemetry feedback loops, and IEEE 1547 grid compliance tests prior to final asset handover.
Implementation Rule: Field engineers must sign off on each verification milestone digitally within the construction flow optimizer platform to unlock downstream crew work fronts.
Field Case Study: Real-World Application
To demonstrate the practical impact of an integrated construction modeling approach, consider a recent 300 MWdc utility-scale photovoltaic installation deployed across challenging geotechnical terrain in the American Southwest. The project initially relied on conventional siloed scheduling, where civil piling crews operated independently from mechanical module mounting teams. This fragmented methodology caused catastrophic schedule slippage when foundation refusal rates spiked in caliche soil layers.
By deploying a comprehensive solar construction flow optimizer, project management restructured the workflow to model the exact dependency chain from Total Piles down to final grid Commercial Operation Date (COD). The intervention successfully identified and resolved critical resource constraints before they impacted project milestones.
Field Problem Analysis
Siloed schedule management and inaccurate pile-to-tracker correlation severely disrupted downstream installation fronts across the 300 MWdc site.
- Geotechnical refusal in dense caliche soils forced unanticipated pre-drilling, reducing piling crew daily production by 40 percent below baseline.
- Because the initial schedule treated piling in isolation, module mounting crews mobilized on schedule only to find zero completed tracker rows available for assembly.
- Idle module installation crews resulted in excessive labor burn rates and 145,000 in weekly standby costs.
- Mismatch between Piles per Tracker Row (P_tr) and actual delivered torque tube lengths required field shimming and engineering redesigns.
- Mechanical completion milestone dates slipped by six weeks, threatening impending power purchase agreement (PPA) sunset deadlines and tax equity financing triggers.
Project Outcome & Flow Optimization Results
Implementation of the integrated construction flow model realigned all downstream dependencies, recovered lost schedule time, and achieved successful COD ahead of contractual deadlines.
- Dynamic recalculation of Piles per Tracker Row allowed engineers to optimize row configurations around pre-drilled zones without halting tracker assembly.
- Linking Tracker Crew Productivity (CP_trk) and Module Crew Productivity (CP_mod) to real-time site feed rates eliminated crew standstills and optimized trade sequencing.
- Mechanical completion duration was compressed by 22 percent through parallelized sub-array handover protocols.
- The project achieved full grid synchronization and COD two weeks ahead of the contractual PPA deadline, saving 2.1 million in liquidated damages.
- Compliance with ASCE and IEEE standards was verified digitally, securing flawless audit sign-offs from independent engineers.
Recommendation for Future Projects: Utility-scale solar developers should mandate integrated construction flow modeling in all EPC contracts to ensure that upstream geotechnical variances automatically adjust downstream resource allocations and maintain deterministic pathways to COD.
Frequently Asked Engineering Questions
How does a solar construction flow optimizer prevent site bottlenecks?
- Synchronizes pile installation rates with downstream mechanical crews.
- Accounts for equipment transfer times across undulating terrain.
- Flags crew idle time caused by slow piling progress.
What is the mathematical link between total piles and tracker installation duration?
- Divides Total Piles by Piles per Tracker Row to find Row Count.
- Divides Row Count by Tracker Crew Productivity to calculate days.
- Feeds directly into the Mechanical Completion milestone timeline.
Why must module installation be modeled alongside mechanical tracker assembly?
- Calculates Total Modules from row counts and modules per row.
- Applies Module Crew Productivity to establish parallel durations.
- Prevents electrical commissioning from stalling due to missing modules.
How do mechanical completion and commissioning interact in the flow model?
- Merges tracker and module duration streams into a unified turnover date.
- Feeds block-by-block status into high-voltage testing schedules.
- Removes administrative guesswork from COD milestone forecasting.
What data inputs are required to run an effective solar construction flow optimizer?
- Exact geotechnical pile refusal distributions and driving logs.
- Manufacturer data on tracker geometry and module counts per row.
- Empirical crew production rates adjusted for regional weather conditions.
Based on my two decades of executing utility-scale PV projects, never evaluate pile driving productivity as a standalone metric on sites with variable subsurface conditions. You must enforce the following professional guidelines during project planning:
- If geotechnical refusal rates exceed 15 percent during early mobilization, immediately dial back tracker assembly crew allocations in your flow model to prevent massive material staging bottlenecks.
- Choose a dynamic flow optimizer over static spreadsheet schedules whenever your site layout exceeds 250 megawatts, as manual linkage of piles to tracker rows inevitably hides critical path delays.
- Direct your mechanical superintendents to tie daily QA/QC sign-offs directly to the module installation stream so that punch-list items do not silently stall electrical commissioning handovers.
- Incorporate weather contingency buffers directly into the dual-stream duration calculations rather than appending a flat percentage at the project finish line, ensuring realistic Commercial Operation Date forecasting.
Complete Course on
Piping Engineering
Check Now
Key Features
- 125+ Hours Content
- 500+ Recorded Lectures
- 20+ Years Exp.
- Lifetime Access
Coverage
- Codes & Standards
- Layouts & Design
- Material Eng.
- Stress Analysis