Pipeline Route Survey: Engineering Standards & Methodology
A robust Pipeline Route Survey is the cornerstone of any successful midstream infrastructure project, dictating the financial viability and safety of the asset before a single pipe is welded. This critical Pre-FEED and Detailed Engineering phase involves the systematic collection of topographical, geotechnical, and cadastral data to establish the optimal path. By integrating modern remote sensing with traditional ground truthing, engineers can minimize environmental impact and reduce construction costs.
What is a Pipeline Route Survey?
It is a comprehensive engineering investigation used to define the specific corridor (Right of Way) for a pipeline. It encompasses the identification of physical obstacles, soil conditions, and legal boundaries to ensure the pipeline is constructible, maintainable, and compliant with codes like ASME B31.4 and B31.8.
Knowledge Check: Route Engineering
Question 1 of 5Loading…
Explanation:
Complete Course on
Piping Engineering
Check Now
Key Features
- 125+ Hours Content
- 500+ Recorded Lectures
- 20+ Years Exp.
- Lifetime Access
Coverage
- Codes & Standards
- Layouts & Design
- Material Eng.
- Stress Analysis
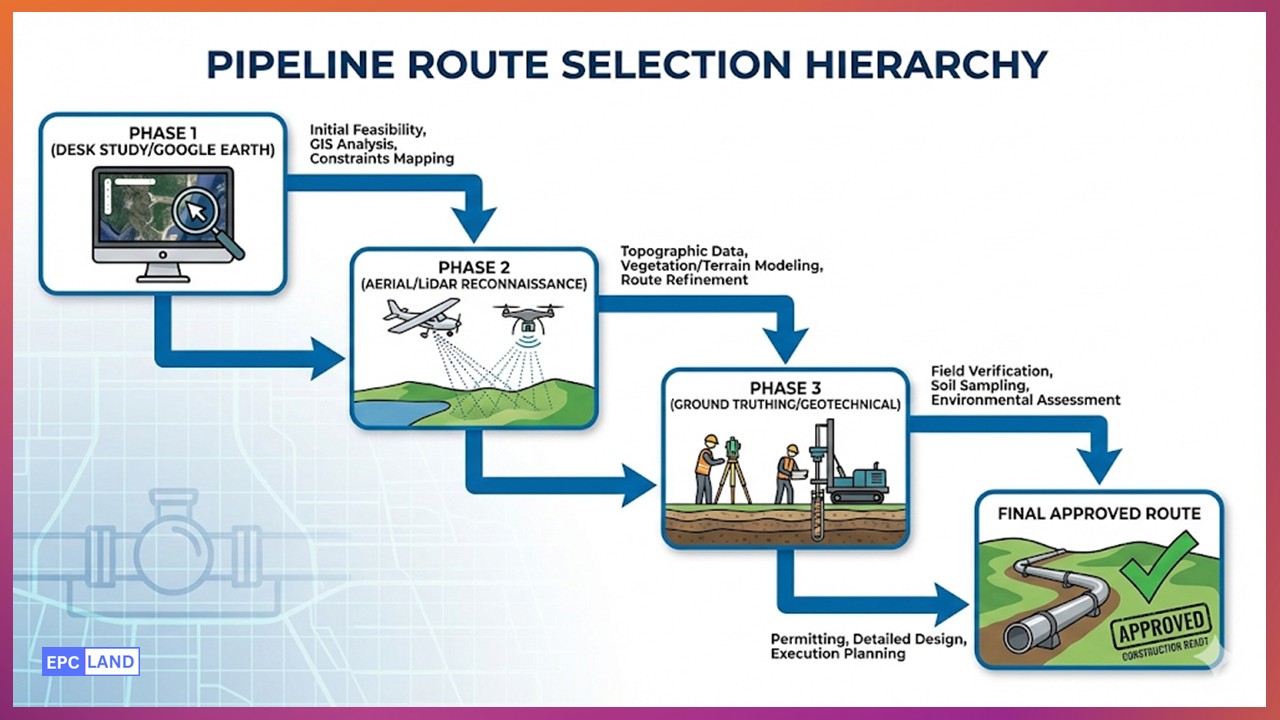
Comprehensive Survey Methodology
Executing a compliant Pipeline Route Survey involves a tiered approach, moving from macro-level desk studies to micro-level ground investigations. The primary objective is to define a centerline that balances hydraulic efficiency with constructibility, while strictly adhering to Pipeline Right of Way (RoW) Optimization principles.
Phase 1: Desk Study & Route Screening
Before boots hit the ground, engineers utilize GIS in Pipeline Routing to layer satellite imagery, existing utility maps, and cadastral data. This phase identifies “fatal flaws” such as protected wetlands, dense urbanization, or historical sites. The output is typically a 1-2 km wide “interest corridor” rather than a fixed line.
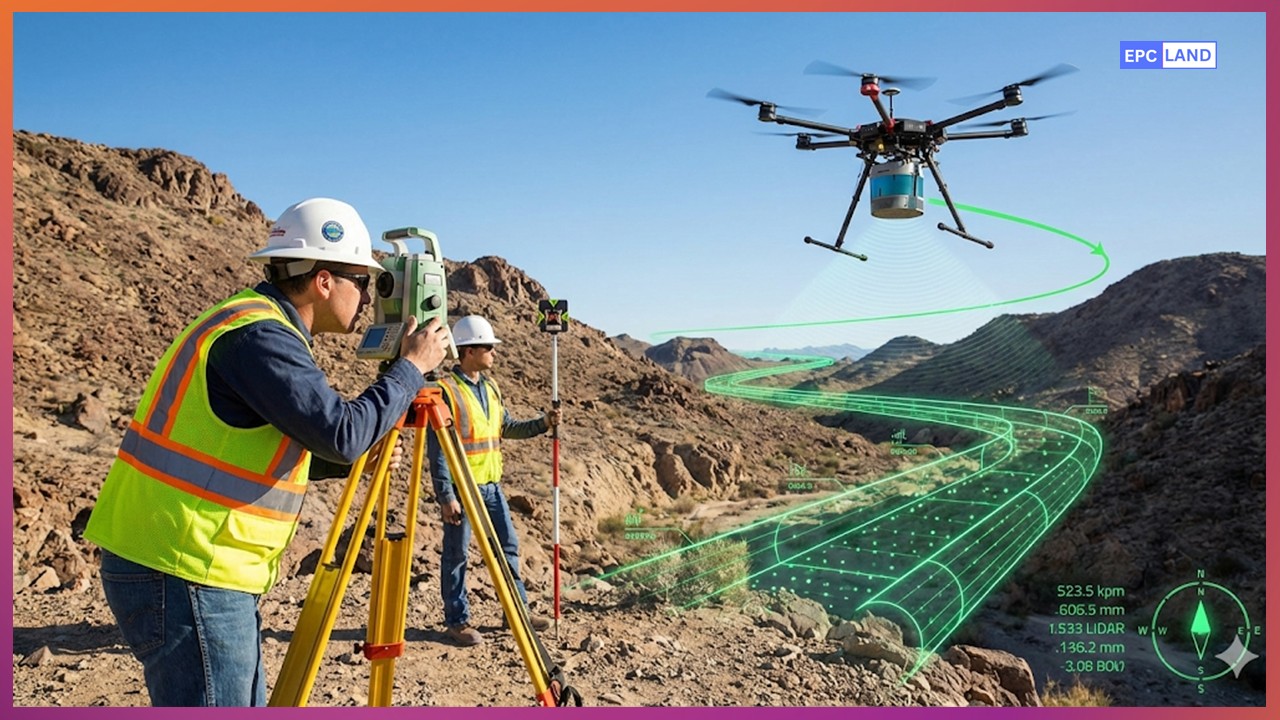
Phase 2: Topographical & Aerial Reconnaissance
Once the corridor is defined, modern LiDAR Pipeline Survey Technology becomes the standard for rapid data acquisition. Unlike traditional photogrammetry, LiDAR (Light Detection and Ranging) shoots laser pulses that penetrate vegetation canopies to map the bare earth. This results in a Digital Terrain Model (DTM) accurate to within 5-10cm vertically, which is crucial for hydraulic flow modeling and hydrostatic testing profiles.
However, traditional Topographical Survey Methods using Total Stations and RTK-GPS (Real-Time Kinematic) are still mandatory for tying in “hard spots” like existing valve stations, road crossings, and tie-in points where millimeter accuracy is required.
Geotechnical Investigation for Pipelines
A Pipeline Route Survey is incomplete without understanding the sub-surface. Geotechnical Investigation for Pipelines focuses on soil mechanics to determine trench stability and buoyancy control requirements. Key parameters analyzed include:
- Soil Bearing Capacity: Ensures the ground can support heavy side-booms and pipe layers during construction.
- Thermal Conductivity: Critical for heated oil pipelines to design insulation and prevent wax appearance.
- Soil Resistivity: Directly influences the design of the Cathodic Protection (CP) system. High resistivity soils may require deep well groundbeds.
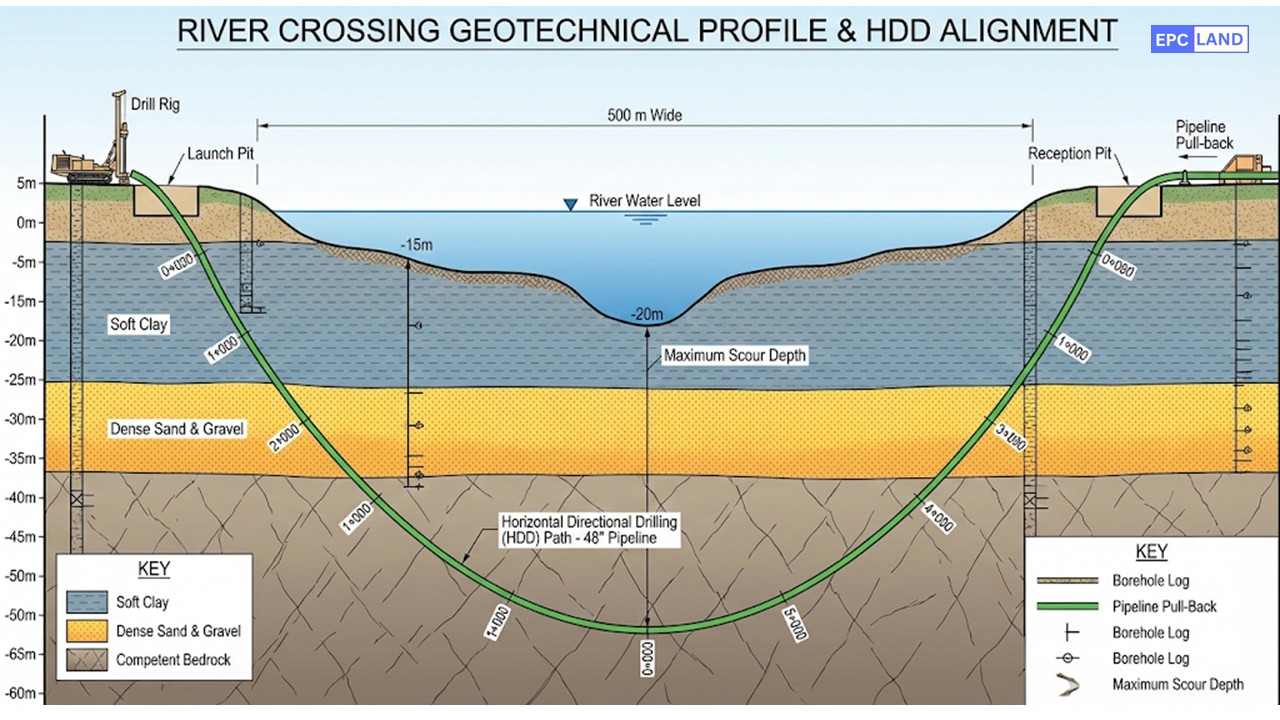
- Scour Depth: Essential for river crossings to ensure the pipe is buried below the maximum potential erosion depth.
🧮 Engineering Calculation: Elastic Bending Radius
During the route survey, engineers must verify that route curves accommodate the pipe’s natural flexibility without requiring cold bends or induction bends (which increase cost). The minimum elastic bending radius is calculated to keep stress below the yield limit.
Where:
- Rmin = Minimum Elastic Bend Radius (inches or mm)
- E = Modulus of Elasticity (e.g., 29,000,000 psi for Steel)
- D = Outside Diameter of the Pipe
- Sa = Allowable Stress (Typically 60-75% of SMYS depending on code)
Note: If the surveyed route curve radius is less than Rmin, the survey team must widen the curve or the design must specify cold bends.
Survey Standards & Data Requirements
Engineering deliverables must adhere to strict international codes. The table below outlines the typical data requirements for a Detailed Engineering Pipeline Route Survey.
| Survey Component | Governing Code | Data Accuracy (Vert/Horiz) | Primary Application |
|---|---|---|---|
| Centerline Topography | ASME B31.4 / B31.8 | V: ±0.1m / H: ±0.1m | Hydraulic Profiles, Cut & Fill Volumes |
| Utility Crossings | ASCE 38-02 (SUE) | V: ±0.05m / H: ±0.05m | Collision Avoidance, Crossing Design |
| River/Waterbody | USACE Hydrographic | Bathymetric: ±0.1m | HDD Design, Buoyancy Control |
| Geotechnical Boreholes | ASTM D1586 (SPT) | N/A (Material Property) | HDD Feasibility, Foundation Design |
Case Study: Complex River Crossing Optimization
Project: 24-inch High-Pressure Gas Transmission Line (NPS 24)
Location
Rocky Mountain Region, USA
Challenge
850m HDD River Crossing
Outcome
USD 2.2M Cost Avoidance
The Challenge: “Blind” Drilling Risks
During the FEED stage of a 150km gas pipeline, the route necessitated crossing the “Whitewater River,” a span of approximately 850 meters. Initial desktop studies, based on 1980s geological maps, suggested the sub-surface was predominantly uniform stiff clay—ideal for Horizontal Directional Drilling (HDD).
However, proceeding with this limited data would have been catastrophic. A critical component of modern Pipeline Crossing Survey Requirements is identifying “cobble lenses” (loose rock layers) which can cause borehole collapse, loss of drilling fluid (frac-out), and ultimately, the entrapment of the drill string.
The Solution: Integrated Geophysics
The EPC contractor engaged a specialized survey team to conduct a detailed “Hybrid Geophysical Investigation” before finalizing the drill path. The scope included:
- Electrical Resistivity Tomography (ERT): Scanned the riverbed to a depth of 40 meters to identify changes in soil stratigraphy.
- Bathymetric Survey: Mapped the river bottom with multi-beam sonar to determine the precise “No-Drill Zone” to avoid scour exposure.
- Confirmatory Boreholes: Two deep boreholes were drilled on either bank to calibrate the ERT data.
The Discovery: The ERT data revealed a massive, previously undocumented gravel and cobble layer extending 12 meters below the riverbed—exactly where the initial HDD path was designed. Drilling here would have resulted in 100% failure.
Project Impact & ROI
By adhering to strict Pipeline Crossing Survey Requirements, the engineering team redesigned the HDD profile. The entry and exit angles were steepened (from 10 degrees to 14 degrees) to push the drill path deep into the stable bedrock layer, well below the problematic cobbles.
EPCLand YouTube Channel
2,500+ Videos • Daily Updates
Frequently Asked Questions
How does LiDAR Pipeline Survey Technology compare to traditional photogrammetry?
What is the role of GIS in Pipeline Routing post-survey?
Why are Pipeline Crossing Survey Requirements stricter than the main line?
Can a Route Survey be used for Class Location determination?
Engineering the Optimal Path
A Pipeline Route Survey is not merely a data collection exercise; it is the strategic foundation of pipeline safety and profitability. By investing in high-fidelity LiDAR, rigorous geotechnical investigations, and adhering to 2026 engineering standards, operators can de-risk construction and ensure long-term integrity.
© 2026 Epcland Engineering. All rights reserved.

Related posts:
![A mechanical sucker rod pumpjack operating in an oil field at sunset]()
What is Sucker Rod Pump System in Oil Production?
![Piping material engineer reviewing technical specifications on a tablet in an industrial plant.]()
How a Piping Material Engineer Drives Industrial Project Success
![Industrial refinery plant showing various types of static equipment]()
What is Static Equipment? Types and List of Static Equipments
![Side-by-side comparison of industrial process piping and power plant steam piping systems.]()
Differences Between ASME B31.3 and B31.1: B31.3 vs B31.1
![Large industrial steel storage tank under construction with cranes and scaffolding]()
Storage Tank Construction Method Statement: Step-by-Step Engineering Guide
![Cutaway diagram of a globe control valve highlighting the internal valve trim components]()
What is a Valve Trim? Types, Components, and Selection