Optimizing Module Installation Productivity: A Field-Tested Formula
- Calculate baseline productivity using our standardized field formula.
- Identify the six interacting variables that dictate daily installation speed.
- Scale operations predictably from a single crew up to six parallel teams.
Maximizing Module Installation Productivity in the Field
Balancing Module Installation Productivity and Quality Control
Advantages
- Accelerates mechanical completion dates, allowing early transition to the electrical commissioning phase.
- Reduces overall project overhead costs by minimizing the duration of heavy equipment rentals and site security.
- Optimizes labor utilization by keeping downstream wire-management and testing crews consistently supplied with work.
- Improves project predictability, making it easier to secure grid connection windows with local utilities.
Disadvantages
- Increases the risk of micro-cracking in PV cells due to rushed handling and improper panel placement.
- Elevates physical fatigue among installers, which can lead to safety incidents or high labor turnover.
- Can result in alignment errors that cause structural binding on single-axis trackers during daily operation.
- Places immense strain on the site logistics team to maintain the rapid pace of material consumption.
Real-World Applications of Installation Metrics
Module Installation Productivity Benchmarks
Installation Productivity Benchmarks: These standardized metrics define the baseline installation rates for utility-scale solar projects under varying site complexities. They establish clear performance targets aligned with standard construction schedules and labor allocation plans.
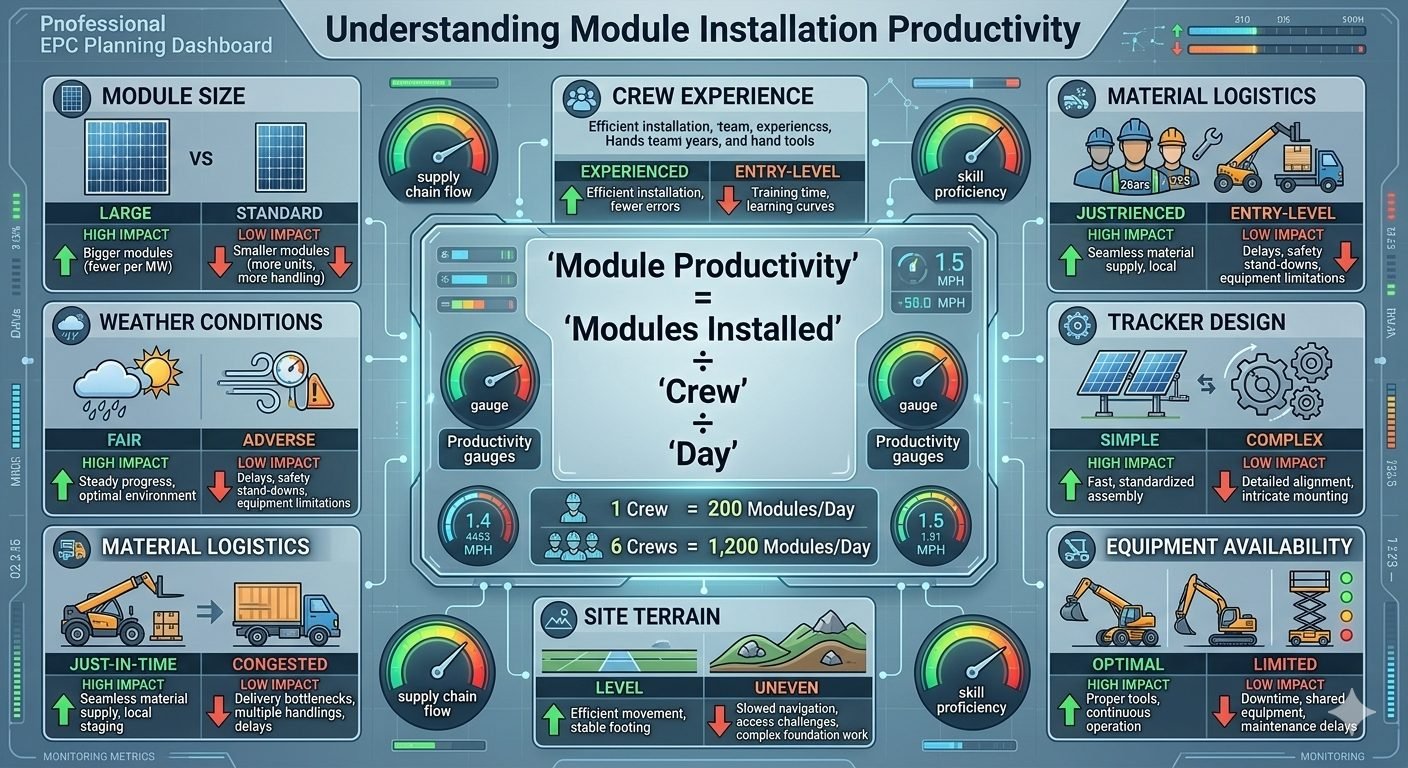
In my twenty years of managing utility-scale solar installations, I have observed that tracking labor efficiency requires a standardized mathematical baseline. The fundamental formula we utilize in the field is straightforward: Module Productivity equals Modules Installed divided by Crew divided by Day. When managing a single optimized crew, a baseline rate of 200 modules per day is the standard industry expectation.
Scaling this operation up to six parallel crews allows us to achieve a cumulative target of 1,200 modules daily, provided site logistics remain uncompromised. However, this linear scaling is frequently disrupted by the six interacting variables: module physical dimensions, crew competency, local weather patterns, staging logistics, tracker mechanical complexity, and terrain slope.
To prevent scheduling overruns, engineers must adjust their daily targets based on these environmental and mechanical constraints. The table below outlines how these specific variables shift our baseline calculations, allowing project managers to forecast realistic mechanical completion dates.
| Productivity Factor | Standard Baseline (200 Mod/Crew/Day) | Adverse/Complex Scenario | Variance Impact |
|---|---|---|---|
| Module Size & Weight | Standard Monofacial (22 kg) | Large Bifacial (32 kg+, dual-glass) | -15% to -25% speed reduction |
| Crew Experience | Experienced Lead + Trained Labor | Entry-Level / High Turnover Crew | -30% output drop |
| Weather Conditions | Clear, dry, wind under 15 km/h | High wind (25 km/h+), extreme heat | -40% or complete stand-down |
| Material Logistics | Just-in-Time (JIT) staging at pile | Congested central yard, double-handling | -20% delay factor |
| Tracker Design | Simple slide-and-clamp system | Complex bolt-through, high torque specs | -15% assembly speed |
| Site Terrain | Flat, dry, clear access roads | Steep slopes, rocky, muddy pathways | -10% to -20% transport delay |
Technical Mapping & Specifications Matrix
Technical Specifications Matrix: This structured framework maps the physical parameters, engineering standards, and operational constraints governing solar module installation. It provides field engineers with a direct reference for quality control and mechanical compliance.
To maintain structural integrity during rapid mechanical completion, field teams must align their installation speed with rigorous engineering standards. In my experience, rushing the assembly process without verifying torque specifications or structural load limits leads to micro-cracking and long-term mechanical failure.
This matrix maps the critical physical parameters of the installation process against their governing international standards, such as ISO and IEC guidelines. By understanding these technical boundaries, engineering procurement construction (EPC) managers can balance speed with structural compliance.
Every component, from the structural steel piles to the anodized aluminum module frames, has specific mechanical tolerances that must be respected. The following matrix serves as a technical reference sheet for quality control managers operating on-site to ensure that high-speed installation does not compromise structural safety.
| Technical Entity | Physical Parameter | Governing Standard | Field Tolerance / Limit |
|---|---|---|---|
| Module Frame Clamping | Clamping pressure & position | IEC 61215 | Must match manufacturer mounting zones (+/- 5mm) |
| Structural Fasteners | Torque values (N-m) | ASME B18.2.1 | Typically 9 to 12 N-m (calibrated torque wrench) |
| Grounding & Bonding | Electrical continuity (Ohms) | UL 2703 | Less than 0.1 Ohms resistance across joints |
| Tracker Alignment | East-West / North-South slope | Structural Design Spec | Maximum 10% slope limit for standard trackers |
| Wind Load Resistance | Stow angle & wind speed limit | ASCE 7-16 | Stow lock required if winds exceed 45 km/h during build |
Site Verification Checklist
Site Verification Checklist: This operational protocol outlines the mandatory field checks required before, during, and after the module installation process. It ensures that all mechanical connections, structural alignments, and safety parameters comply with engineering designs.
Before deploying crews to execute the daily target of 200 modules per team, a rigorous pre-construction verification must occur. In my experience, skipping these preliminary checks leads to compounding delays where crews are left waiting for materials or correcting structural misalignments.
The checklist below is designed to prevent these bottlenecks by establishing clear gates of responsibility. Each step must be signed off by the lead field engineer before the next phase of mechanical completion begins.
First, the structural foundation must be verified. This includes checking that the tracker torque tubes are perfectly level and that the mounting brackets are spaced according to the module’s physical dimensions. Second, material logistics must be coordinated to ensure that modules are staged directly at the pile locations. This minimizes double-handling and reduces the risk of physical damage during transport.
Third, safety protocols must be established, particularly regarding wind speed monitoring. If local wind speeds exceed the manufacturer’s safe handling limits, work must be suspended immediately to protect both the crew and the equipment. Finally, post-installation quality audits must be conducted on a random sampling of at least 10% of the daily output. This audit should verify torque values using calibrated digital torque wrenches and check for any visible frame deformation.
By adhering to this structured verification process, project managers can maintain a steady installation velocity while ensuring full compliance with UL 2703 and structural engineering designs.
Daily Field Verification Steps
-
Pre-Installation: Tracker Alignment Audit
Verify torque tube levelness and bearing alignment across the entire row. Ensure deviation is within +/- 2 degrees of design specifications.
-
Pre-Installation: Material Staging Verification
Confirm that module pallets are staged within 10 meters of the target tracker row. Verify that packaging is intact and free from moisture damage.
-
Active Installation: Clamping & Torque Control
Monitor crew clamping techniques. Ensure mid-clamps and end-clamps are seated flat against the module frame and torqued to exactly 10 N-m.
-
Active Installation: Cable Management & Routing
Verify that module jumpers are secured using UV-stabilized clips. Ensure cables do not touch the ground or sharp metal edges of the tracker.
-
Post-Installation: Grounding Continuity Check
Perform random resistance testing across the module-to-tracker interface. Confirm resistance is below 0.1 Ohms to satisfy UL 2703 requirements.
Field Case Study: Real-World Application
Field Case Study: This analysis examines a real-world utility-scale solar project to demonstrate how interacting productivity factors impact mechanical completion timelines. It highlights the practical application of our installation formula under challenging field conditions.
During a recent 150-megawatt utility-scale project in West Texas, our construction schedule faced severe delays due to a combination of adverse environmental conditions and logistical bottlenecks. The site was characterized by high afternoon winds exceeding 30 kilometers per hour, which regularly halted module handling.
In tandem with this, the local labor pool consisted primarily of entry-level workers with zero prior solar experience. This lack of training resulted in improper clamping techniques and high rates of module frame damage.
To make matters worse, the central staging yard was highly congested, forcing crews to double-handle pallets and transport them over rough, unpaved terrain using inadequate equipment. Our initial productivity calculations showed a dismal output of only 90 modules per crew per day, far below our target baseline of 200.
In my experience, analyzing these failures reveals that productivity is never a static metric. It is a dynamic variable that responds immediately to management interventions. By isolating each of the six interacting factors, we were able to pinpoint the exact bottlenecks choking our workflow.
The West Texas project experienced a severe drop in daily installation velocity due to compounding environmental and operational bottlenecks.
- High afternoon winds exceeding 30 kilometers per hour that halted safe module handling.
- Untrained local labor force unfamiliar with torque specifications and clamping zones.
- Congested central staging yard requiring extensive double-handling of pallets.
- Rough, unpaved site terrain causing transport vehicle breakdowns.
Implementing a targeted remediation plan restored our installation velocity and exceeded our baseline productivity targets.
- Transitioned to a Just-in-Time staging model, placing pallets directly at the pile locations.
- Established an on-site training academy to certify workers on mock-up tracker rows.
- Swapped complex bolt-through fasteners for a simplified slide-and-clamp tracker design.
- Achieved an average installation rate of 210 modules per crew per day.
- Scaled operations to six parallel crews to install 1,260 modules daily.
Based on this experience, I highly recommend that project managers conduct a thorough logistics and labor assessment at least thirty days before mechanical mobilization. Ensuring that materials are staged close to the piles and that crews are pre-certified on the specific tracker design is the only way to guarantee consistent daily output.
Frequently Asked Engineering Questions
How do you calculate module installation productivity on a utility-scale solar site?
- Standard Formula: Module Productivity = Modules Installed ÷ Crew ÷ Day.
- Baseline Output: A single experienced crew typically targets 200 modules per day under normal site conditions.
- Scaling Potential: Six parallel crews operating with synchronized logistics can scale output up to 1,200 modules daily.
How does module size impact overall installation speed and labor requirements?
- Weight Factors: Heavier modules often require two-person lifts or specialized mechanical lift assistance to ensure safety.
- Cycle Time: Slower handling speeds can reduce the total count of modules placed per hour by field teams.
- Wattage Yield: Despite slower individual placement rates, larger modules yield higher total power capacity per install cycle.
What role does tracker design play in optimizing module installation productivity?
- Fastening Systems: Rapid-clamping mechanisms reduce fastening time compared to traditional multi-bolt assemblies.
- Alignment Tolerance: Forgiving tracker tolerances prevent crews from stalling when working on uneven terrain.
- Training Requirements: Complex tracker architectures require specialized training, which often slows down entry-level teams.
How do site terrain and material logistics interact to affect daily installation rates?
- Logistics Strategy: Just-in-time delivery directly to the staging rows prevents double-handling of fragile components.
- Terrain Impact: Optimal, flat terrain allows staging equipment to move rapidly without risking tip-overs or delays.
- Staging Efficiency: Poorly planned material drops force crews to walk long distances, cutting active installation time.
How should project managers adjust productivity targets for adverse weather conditions?
- Wind Thresholds: High winds halt large-module handling to prevent dangerous sail-effect hazards and structural damage.
- Thermal Management: Extreme heat requires mandatory rest cycles, which reduces the active daily working hours of crews.
- Ground Conditions: Wet or muddy terrain slows down heavy equipment transport and disrupts material distribution.
Complete Course on
Piping Engineering
Check Now
Key Features
- 125+ Hours Content
- 500+ Recorded Lectures
- 20+ Years Exp.
- Lifetime Access
Coverage
- Codes & Standards
- Layouts & Design
- Material Eng.
- Stress Analysis