Table of Contents

How to Calculate Lost Time Injury Frequency Rate for Industrial Safety
In my 20+ years of managing large-scale piping installations and refinery construction projects, I have learned that numbers on a spreadsheet tell a very real story about site safety. When we talk about the Lost Time Injury Frequency Rate, we are not just discussing a compliance metric required by regulatory bodies. We are looking at a direct reflection of our operational discipline, the quality of our safety culture, and the physical well-being of our craftspeople on the shop floor.
During my early days as a field engineer, I watched a minor rigging failure halt a critical piping spool lift. The resulting hand injury kept an experienced pipefitter off the site for three weeks. That single incident did more than disrupt our schedule; it spiked our safety metrics and forced us to re-evaluate our entire hazard mitigation workflow. Understanding how to calculate, analyze, and actively reduce this frequency rate is a fundamental skill for any industrial manager or safety professional.
Key Takeaways for Engineering Managers
- Standardized benchmarking allows for direct safety performance comparisons across different project sites and global business units.
- Accurate calculation requires meticulous tracking of both direct hire and subcontractor exposure hours.
- A low frequency rate must be paired with leading indicators to ensure a truly proactive safety culture.
Complete Course on
Piping Engineering
Check Now
Key Features
- 125+ Hours Content
- 500+ Recorded Lectures
- 20+ Years Exp.
- Lifetime Access
Coverage
- Codes & Standards
- Layouts & Design
- Material Eng.
- Stress Analysis
Why Lost Time Injury Frequency Rate Matters
To manage risk effectively on a high-pressure construction site, we must establish a clear mathematical baseline. The frequency rate acts as this baseline, normalizing incident data so that a small fabrication shop with 50 workers can be compared fairly against a massive petrochemical complex employing thousands. Without this normalization, raw incident counts are functionally meaningless for corporate benchmarking.
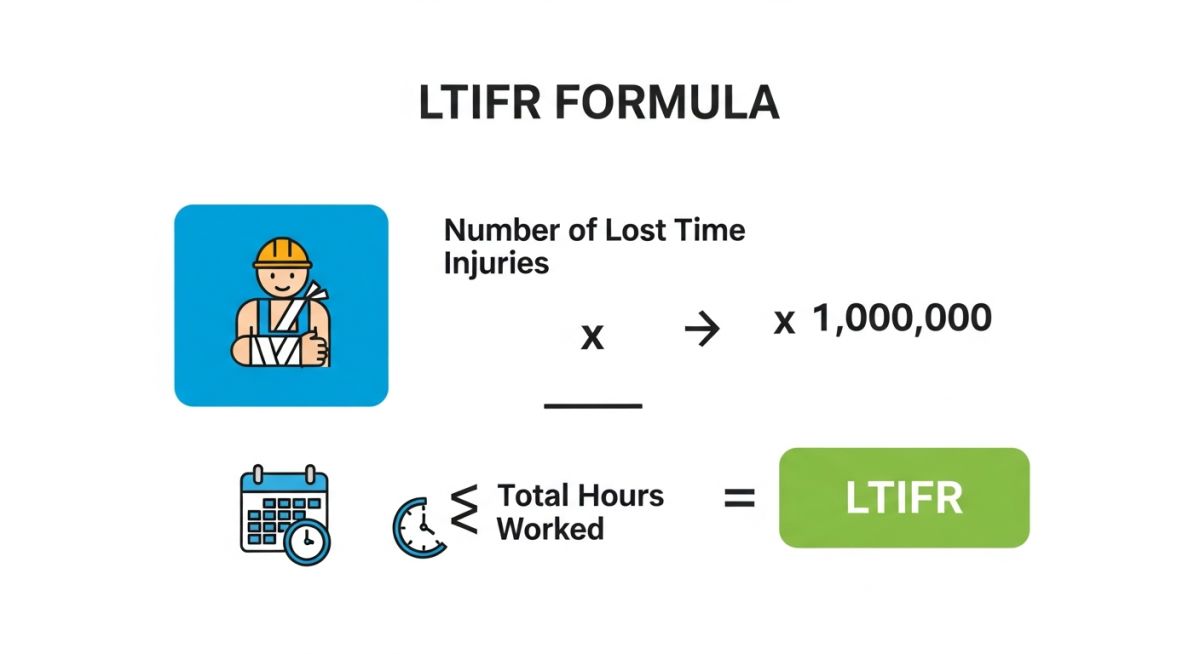
The Mathematical Formula
The standard calculation for this metric is based on a factor of one million man-hours, which is the international benchmark utilized by European and global safety organizations. In contrast, some North American jurisdictions utilize a factor of 200,000 hours (representing 100 full-time workers over a year). For our engineering standards, we will focus on the global one-million-hour standard:
Let us break down the individual components of this equation to ensure absolute clarity during your next site audit:
- Lost Time Injury (LTI): Any work-related injury or illness that results in an employee being physically unable to perform their regular duties, or being absent from work, for at least one full day or shift immediately following the day of the incident. This definition aligns with the OSHA 1904 Recordkeeping Guidelines.
- Total Hours Worked: The actual cumulative hours spent by all employees—including field engineers, administrative staff, direct labor, and subcontractors—performing work-related activities on the project site. This must exclude vacation, sick leave, and paid holidays.
- The Multiplier (1,000,000): A standardized constant representing the approximate hours worked by 500 full-time employees over the course of a calendar year (assuming 2,000 hours per worker per year).
Step-by-Step Calculation Example
Imagine we are managing a major piping pre-fabrication contract for an offshore platform. Over a 12-month period, our site records show the following data:
- Total direct-hire hours: 650,000 hours
- Total subcontractor hours: 450,000 hours
- Recorded Lost Time Injuries: 3 distinct incidents (one rigger slip, one welder flash burn, and one pipefitter hand laceration)
First, we calculate the total exposure hours:
650,000 + 450,000 = 1,100,000 total man-hours
Next, we apply our standard formula:
LTIFR = (3 × 1,000,000) / 1,100,000
LTIFR = 3,000,000 / 1,100,000 = 2.73
This result of 2.73 means that for every million hours worked on our piping project, we can statistically expect 2.73 injuries severe enough to cause lost workdays. In my experience, a rate below 1.0 is considered world-class in heavy industrial construction, while rates above 3.0 indicate a clear need for immediate safety interventions.
Field Warning: The Danger of Underreporting
Relying solely on lagging metrics like this frequency rate can create a false sense of security. If your site team feels pressured to maintain a “zero incident” record to secure project bonuses, they may underreport minor injuries or reclassify lost-time events as restricted duty work. This practice is highly dangerous and violates OSHA compliance standards. Always cross-reference your frequency rates with medical treatment logs and anonymous safety surveys.
Comparing Lost Time Injury Frequency Rate Metrics
To build a robust safety management system, you must understand how different metrics interact. While our primary focus is on lost time, other indicators like the Total Recordable Incident Rate (TRIR) and Severity Rate (SR) provide necessary context regarding the overall hazard landscape of your job site.
| Metric Name | Standard Multiplier | Primary Focus | Regulatory Reference |
|---|---|---|---|
| LTIFR | 1,000,000 hours | Injuries resulting in lost workdays | ISO 45001 / Global Standards |
| TRIR | 200,000 hours | All recordable medical treatments | OSHA Part 1904 |
| Severity Rate (SR) | 1,000,000 hours | Total number of lost days recorded | ANSI Z16.1 Guidelines |
| DART | 200,000 hours | Days away, restricted, or transferred | OSHA Industry Benchmarks |
This technical matrix maps out the core entities, physical parameters, and structural acronyms used by safety engineers to track and audit industrial workplace incidents.
| Entity / Acronym | Technical Definition | Physical Parameter Measured | Standard Reference Link |
|---|---|---|---|
| LTI | Lost Time Injury | Incident count (Integer) | OSHA Recordkeeping |
| Exposure Hours | Actual hours worked on site | Time (Hours) | ISO 45001 Clause 9 |
| LTIFR | Lost Time Injury Frequency Rate | Frequency per 10^6 hours | ILO Safety Statistics |
Implementing a Site Safety Verification Checklist
To actively drive down your frequency rate, you must implement rigorous field verification protocols. In my experience, relying on passive safety policies is never enough; you need active, daily verification on the construction floor. Use this checklist during your weekly safety walks to ensure compliance with ISO 45001 guidelines.
Weekly Field Safety Audit Checklist
-
Man-Hour Tracking Accuracy: Verify that all subcontractor hours are collected weekly and match gate-log access data.
-
Incident Reporting Timelines: Confirm that all minor injuries and near-misses are logged within 24 hours of occurrence.
-
Pre-Task Hazard Assessments: Audit at least three active work crews to ensure Field Level Risk Assessments (FLRAs) are signed and accurate.
-
Emergency Response Readiness: Inspect first-aid stations, eye-wash units, and emergency vehicle access routes for obstructions.
-
Tool and Equipment Integrity: Check that all hand tools, rigging gear, and portable power tools have current color-coded safety inspection tags.
Field Case Study: Real-World Application
The Problem: Escalating Incident Rates during Refinery Expansion
During a major refinery expansion project in 2024, our team faced a severe challenge. Over a six-month period, the site recorded 8 Lost Time Injuries across 1,200,000 worked hours, resulting in an alarming frequency rate of 6.67. The injuries were primarily hand lacerations, slips from scaffolding, and minor burns during piping alignment. This high rate triggered an immediate regulatory audit and threatened to shut down our field operations.
The Outcome: Targeted Interventions and Cultural Shift
We immediately paused non-essential work to conduct a comprehensive safety stand-down. We implemented three key changes: we mandated the use of high-cut-resistant gloves for all piping tasks, introduced a mandatory “buddy system” for scaffolding work, and required daily supervisor audits of all pre-task risk assessments. Over the subsequent 1,500,000 man-hours, we recorded only 1 minor LTI, dropping our frequency rate to an outstanding 0.67.
This dramatic turnaround proved to our entire team that safety is not an abstract concept. By actively tracking our metrics, identifying the root causes of our failures, and implementing targeted physical controls, we protected our workforce and kept our project on track.
What is the difference between LTIFR and TRIR?
Does a first-aid case count as a Lost Time Injury?
How do you handle subcontractor hours in the calculation?
What is a good benchmark for LTIFR in heavy construction?
Can a single incident result in multiple lost time injuries?
How does ISO 45001 view lagging safety metrics?
===

Related posts:
![A mechanical sucker rod pumpjack operating in an oil field at sunset]()
What is Sucker Rod Pump System in Oil Production?
![Piping material engineer reviewing technical specifications on a tablet in an industrial plant.]()
How a Piping Material Engineer Drives Industrial Project Success
![Industrial refinery plant showing various types of static equipment]()
What is Static Equipment? Types and List of Static Equipments
![Side-by-side comparison of industrial process piping and power plant steam piping systems.]()
Differences Between ASME B31.3 and B31.1: B31.3 vs B31.1
![Large industrial steel storage tank under construction with cranes and scaffolding]()
Storage Tank Construction Method Statement: Step-by-Step Engineering Guide
![Cutaway diagram of a globe control valve highlighting the internal valve trim components]()
What is a Valve Trim? Types, Components, and Selection