Green Methanol Production Economics: India’s Strategy & Cost Comparison (2026)

Green Methanol Production Economics is rapidly becoming the critical KPI for energy investors in India as the nation pivots away from coal-dominant feedstocks. With the implementation of the National Green Hydrogen Mission India, the cost parity between traditional “Grey” methanol—produced via coal gasification—and emerging “Green” variants (Bio-Methanol and E-Methanol) is narrowing. This guide provides a granular engineering analysis of the CAPEX, OPEX, and strategic viability of these fuels in the 2026 landscape.
What defines the Economics?
The economics of methanol are primarily driven by the Levelized Cost of Methanol (LCOM). This metric aggregates the Feedstock Cost (Coal vs. Biomass vs. H2), Energy Cost (Grid vs. Renewable), and Carbon Taxation/Credits (ETS) into a single price per metric ton ($/MT or INR/MT), determining commercial feasibility against fossil-fuel baselines.
🧪 Knowledge Check: Methanol Economies
1. What is the primary feedstock for “Grey Methanol” in the Indian context?
Complete Course on
Piping Engineering
Check Now
Key Features
- 125+ Hours Content
- 500+ Recorded Lectures
- 20+ Years Exp.
- Lifetime Access
Coverage
- Codes & Standards
- Layouts & Design
- Material Eng.
- Stress Analysis
Comparative Economics: Grey, Bio, and E-Methanol
To understand Green Methanol Production Economics in 2026, we must first establish the baseline against which all projects are financed. In India, the market is currently dominated by Grey Methanol derived from imported natural gas or domestic coal. However, the National Green Hydrogen Mission India has fundamentally altered the ROI calculations for future plants, creating a tripartite market structure.
1. Grey Methanol (The Baseline)
Grey Methanol represents the incumbent technology. In the Indian context, this specifically refers to Coal Gasification to Methanol India projects (often championed by entities like CIL and BHEL). While the technology is mature (TRL 9), the economics are heavily tied to feedstock volatility and emerging carbon taxes.
- Feedstock: High-Ash Indian Coal or Imported Natural Gas.
- Economic Status: Lowest CAPEX ($0.5–0.8M per TPD capacity).
- Risk: High exposure to Carbon Border Adjustment Mechanism (CBAM) penalties.
2. Bio-Methanol (The Transition)
Bio-Methanol offers a "bridge" solution. It utilizes agricultural residue (rice straw, bagasse)—a resource India has in abundance. The Grey vs Green Methanol Cost Analysis often highlights Bio-Methanol as the lower-hanging fruit compared to E-Methanol because it does not require expensive electrolyzers. However, the OPEX is plagued by supply chain logistics: gathering biomass from fragmented farmers is operationally intensive.
3. E-Methanol (The Future)
E-Methanol is the "Champagne" of clean fuels, synthesized by combining Green Hydrogen (via electrolysis) and captured CO2. This path aligns directly with the Methanol Blending Mandate 2026 targets for decarbonizing shipping and heavy transport. While CAPEX is highest, OPEX is purely a function of renewable energy costs ($/kWh).
Calculating the Levelized Cost (LCOM)
The standard metric for comparing these technologies is the Levelized Cost of Methanol (LCOM). Engineering firms use this to determine the breakeven price required for a project to be bankable.
// LCOM Simplified Formula
LCOM = (I × CRF + OM + F + C) / P
- LCOM : Levelized Cost ($/Ton)
- I : Total Investment (CAPEX)
- CRF : Capital Recovery Factor (Interest Rate & Lifespan)
- OM : Annual O&M Costs
- F : Fuel/Energy Cost (Electricity or Biomass)
- C : Carbon Tax / Credit Revenue (Negative if credit)
- P : Annual Production (Tons)
When performing a Bio-Methanol vs E-Methanol Efficiency check, the variable F (Energy Cost) dictates the winner. Bio-methanol is thermodynamically more efficient (~50-60%) compared to the round-trip efficiency of E-Methanol (~40-50%), but E-Methanol scales better effectively with unlimited solar/wind resources.
📊 2026 Engineering Economic Matrix (India)
| Parameter | Grey Methanol (Coal) | Bio-Methanol | E-Methanol (Green H2) |
|---|---|---|---|
| Est. CAPEX ($/TPA) | $400 - $600 | $800 - $1,100 | $1,800 - $2,500 |
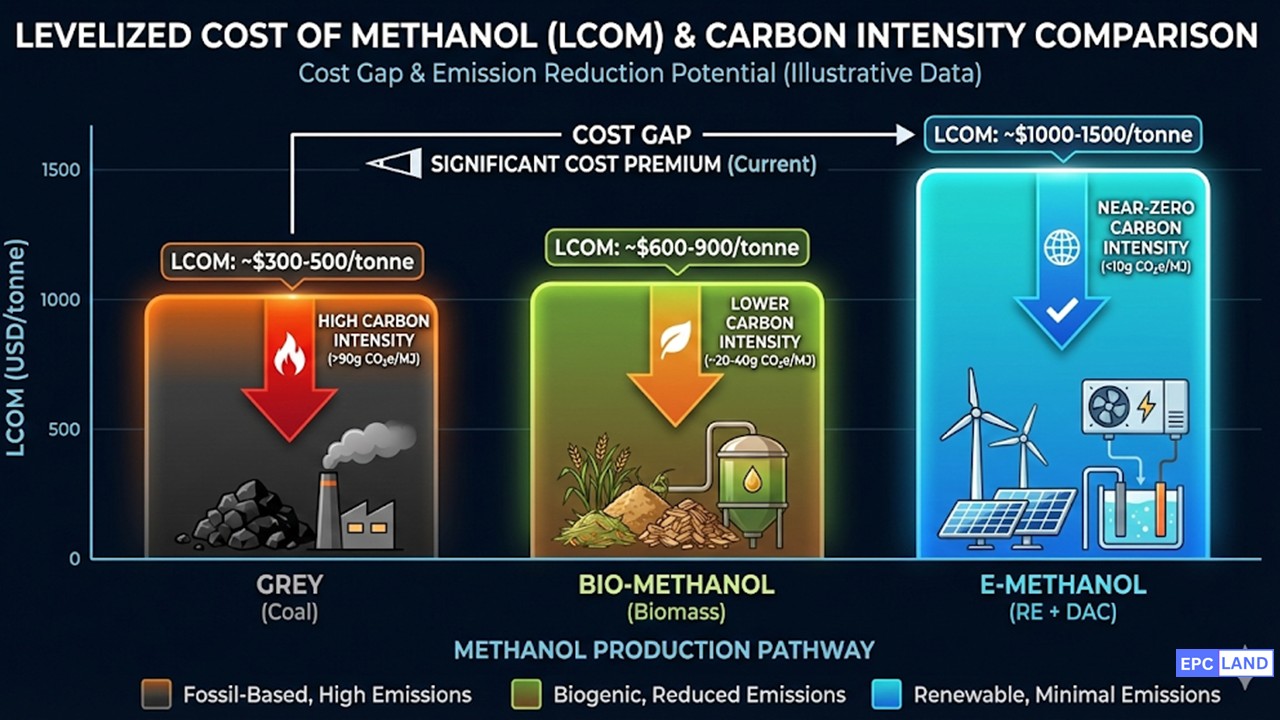
| LCOM ($/Ton) | $250 - $350 | $600 - $850 | $800 - $1,200 |
| Primary Cost Driver | Coal Price | Biomass Logistics | Electricity (Needs <$0.03/kWh) |
| Carbon Intensity (gCO2/MJ) | 90 - 100 (High) | 10 - 20 (Low) | < 5 (Near Zero) |
| India Scalability | High (Abundant Coal) | Medium (Seasonality) | Very High (Solar/Wind) |
*Data estimates based on Epcland Q1 2026 market analysis.
The table above illustrates the dilemma. Green Methanol Production Economics currently show a 3x-4x premium over Grey Methanol. However, with the upcoming carbon taxes and subsidies, the gap is projected to close by 2030, particularly for the Gujarat-based projects discussed in the next section.
Deep Dive: LCOM Engineering Analysis (India 2026)
A granular breakdown of the financial inputs specifically for Indian Green Methanol Production Economics.
1. The Expanded LCOM Formula
While the simplified formula gives a quick estimate, the Bankable Feasibility Study (BFS) uses the Discounted Cash Flow (DCF) method. In the Indian context, the Discount Rate (r) is critical due to higher interest rates compared to EU/US markets.
Weighted Average Cost of Capital. In India (2026), typically 10% - 12%.
Cost of Green Hydrogen (Electrolysis) + CO2 Sourcing.
Project Year (Standard Lifetime: 20-25 Years).
Revenue from trading ACC (Green H2 certificates) or Carbon Credits.
2. Sensitivity Analysis: The "Power Price" Effect
The single largest factor affecting Green Methanol Production Economics is the cost of electricity. Since ~10 MWh of energy is required to produce 1 Ton of E-Methanol (via the H2 route), a minor fluctuation in solar/wind tariffs drastically shifts the LCOM.
The table below demonstrates the "India Advantage". While Europe struggles with power costs >$0.05/kWh, India's Rajasthan/Gujarat solar parks can achieve tariffs as low as $0.025/kWh (approx ₹2.00/kWh).
| Renewable Power Cost (₹/kWh) | USD Equivalent ($/kWh) | Resulting LCOM ($/Ton) | Competitiveness Rating |
|---|---|---|---|
| ₹ 4.50 (Grid/Commercial) | $0.054 | $1,350+ | Unviable |
| ₹ 3.00 (Hybrid RE) | $0.036 | $950 - $1,050 | Parity with Bio-Methanol |
| ₹ 2.00 (Captive Solar) | $0.024 | $700 - $800 | Export Competitive (EU) |
| ₹ 1.50 (2030 Target) | $0.018 | $550 - $650 | Disruptive Market Leader |
3. The CAPEX/OPEX Split
Unlike traditional chemical plants where CAPEX amortization dominates the cost, Green Methanol is an OPEX-heavy asset.
- Energy (Electricity): ~60-70% of total LCOM. This confirms that securing cheap power is more important than cheap equipment.
- CAPEX (Electrolyzer + Synthesis): ~20-25%. As Electrolyzer costs fall (Learning Curve), this share will decrease further.
- CO2 Sourcing: ~10-15%. Highly variable depending on source (DAC vs. Point Source).
Cost Component Breakdown
Typical split for an Indian Project (Captive RE)
The "Valley of Death": Challenges to Scaling
While the economics are improving, execution faces significant friction. The transition from Coal Gasification to Methanol India plans to Green Methanol realities is obstructed by five critical barriers.
1. The Biogenic CO2 Scarcity
Global & Indian Issue: Methanol (CH₃OH) requires Carbon. For it to be "Green," the Carbon must be non-fossil (Biogenic or Direct Air Capture).
- The Gap: Sustainable sources of CO2 (distilleries, biogas plants) are small and geographically dispersed.
- The Cost: Aggregating CO2 via truck/pipeline to a central E-Methanol hub adds huge logistical OPEX.
- DAC Reality: Direct Air Capture is technically viable but economically punishing ($300+/ton) in 2026.
🇮🇳 India Challenge: Water Stress
Producing 1 kg of Green Hydrogen via electrolysis requires approx. 9-10 liters of ultra-pure water (plus cooling water).
🌍 Global Challenge: The "Last Mile"
Green Methanol Infrastructure at ports is lagging behind ship orders.
3. The Intermittency Penalty
Methanol synthesis reactors (Haber-Bosch style loops) operate best at steady-state. They cannot ramp up and down instantly with the sun or wind.
The Engineering Headache:
- Running reactors at partial load degrades catalysts.
- Solution: Massive H2 storage buffers or BESS (Battery) integration.
- Result: This increases the CAPEX of an Indian E-Methanol plant by 30-40% compared to a grid-connected Grey Methanol plant.
4. The Regulatory Maze (Green vs. Low-Carbon)
There is no global standard for "Green." The EU has RED III, India has Green Hydrogen Standards, and the US has the IRA.
The Risk: An Indian developer might produce "Bio-Methanol" using grid backup, only to find it doesn't qualify for European RFNBO (Renewable Fuels of Non-Biological Origin) credits, destroying the export business case.
Case Study: Gujarat E-Methanol Hub Viability Analysis
While theoretical Green Methanol Production Economics suggest a high premium, site-specific optimization can drastically lower the Levelized Cost (LCOM). This case study analyzes a proposed "Power-to-X" mega-project in the Kutch region of Gujarat. The goal: replace imported fossil fuels with domestic E-Methanol for the shipping sector, aligned with the National Green Hydrogen Mission India.

📍 Site Location
Kutch, Gujarat (High Solar/Wind Zone)
⚙️ Configuration
500MW RE Hybrid + 100MW PEM Electrolyzer
🧪 Feedstock
Green H2 + Direct Air Capture (DAC) CO2
🎯 Target Market
Green Shipping Lines (Mundra/Kandla)
The Challenge: The "Intermittency" Premium
The primary enemy of Green Methanol Production Economics is the intermittency of renewable energy. Methanol synthesis reactors (unlike electrolyzers) hate fluctuation; they require steady-state operation for optimal conversion efficiency.
Initially, the project considered a grid-backup approach. However, purchasing industrial grid power in India (at ₹7-8/kWh) destroyed the economic model, pushing the LCOM far beyond the competitive range of Coal Gasification to Methanol India projects.
The Solution: Hybridization & Storage Buffer
The engineering team pivoted to a "Behind-the-Meter" Hybrid approach. By over-sizing the Solar (PV) and Wind capacities by a factor of 1.5x and integrating a Battery Energy Storage System (BESS) buffer, the plant achieved a Capacity Utilization Factor (CUF) of nearly 70% for the electrolyzer.
Furthermore, the CO2 sourcing was hybridized. Instead of relying solely on expensive Direct Air Capture (DAC), the facility was co-located near a cement kiln to capture flue gas. This "Point Source Capture" reduced the CO2 feedstock cost from $300/ton (DAC) to approx $50/ton, significantly improving the Bio-Methanol vs E-Methanol Efficiency calculations.
💰 Economic Result & ROI
By eliminating grid dependency and securing cheaper CO2, the projected LCOM dropped from $1,100/MT to $750/MT. While still higher than Grey Methanol ($300/MT), the gap is bridged by:
- Projected Carbon Credit revenue ($80-100/ton).
- Premium pricing contracts with European shipping liners (Maersk/CMA CGM) mandated to use green fuels.
- PLI (Production Linked Incentive) subsidies from the Indian Government.
EPCLand YouTube Channel
2,500+ Videos • Daily Updates
Frequently Asked Questions: Indian Methanol Strategy
What is the impact of the Methanol Blending Mandate 2026? ▼
How does Grey vs Green Methanol Cost Analysis compare today? ▼
Which is better: Bio-Methanol or E-Methanol? ▼
Does the National Green Hydrogen Mission India cover Methanol? ▼
The Path Forward
The transition from Coal Gasification to Methanol India strategies toward a renewable future is not just an environmental choice—it is becoming an economic inevitability. By 2026, the convergence of cheap solar power, the National Green Hydrogen Mission India incentives, and global shipping mandates will tip the scales.
For investors and EPCs, the message is clear: The premium for Green Methanol is high today, but the cost of inaction will be higher tomorrow.
Start Your Feasibility Study
Related posts:
![High-grade industrial Wing Nut Types and Applications for mechanical assemblies.]()
Wing Nut Types and Applications: The 2026 Engineering Guide
![Industrial Monorail Crane Systems installed in a modern manufacturing plant 2026.]()
Monorail Crane Systems: Design, Types & 2026 Standards Guide
![Lead engineer performing a Factory Acceptance Test FAT on an industrial skid system 2026]()
Factory Acceptance Test FAT: The 2026 Engineering Guide to Zero-Defect Delivery
![Professional engineering workspace showing a Basis of Design document layout for a 2026 project.]()
Basis of Design: How to Write a BOD for Engineering Projects in 2026
![Industrial Flare Knockout Drum Sizing and installation in a refinery relief system.]()
Flare Knockout Drum Sizing: Design & API 521 Standards (2026 Guide)
![Advanced Reboiler Control Systems in a modern petrochemical refinery 2026.]()
Reboiler Control Systems: Engineering Guide to Precision Control 2026