The Strategic Guide to Green Ammonia Plant Cost Estimation during FEED

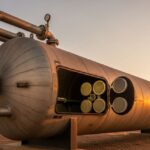
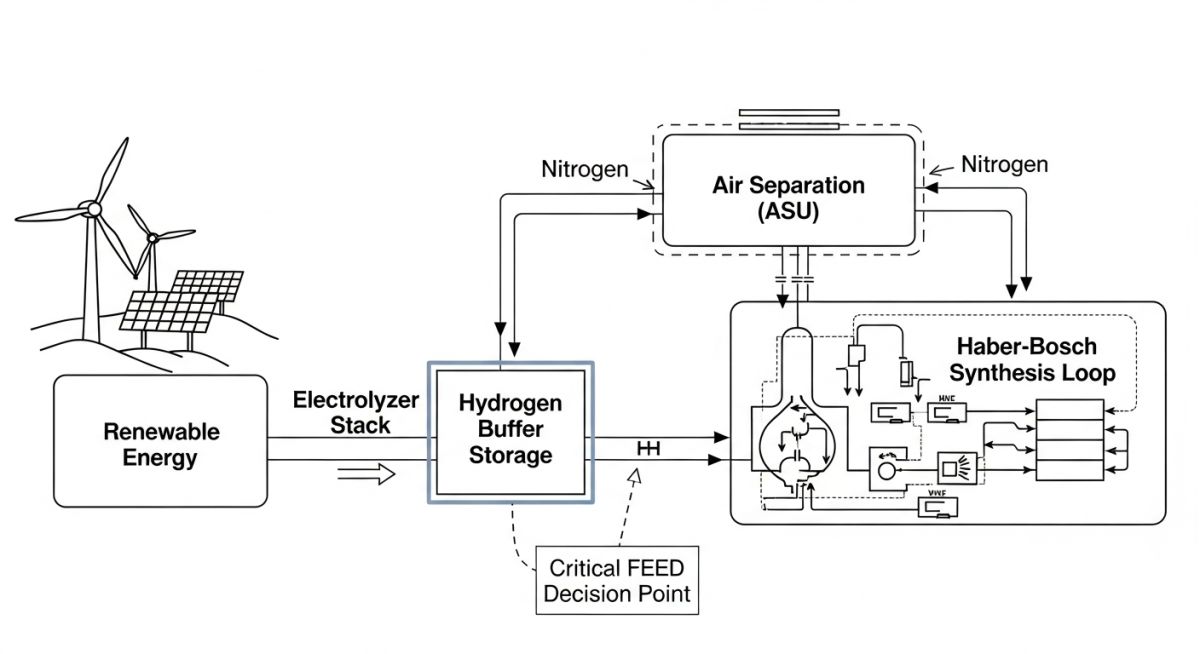
Figure 1: Conceptual layout of a 2026 Green Ammonia hub integrating wind power, electrolysis, and synthesis.
Establishing a robust Green Ammonia Plant Cost Estimation is the most critical hurdle for developers transitioning from pilot schemes to world-scale production. Unlike traditional “Grey” ammonia, which relies on steam methane reforming (SMR), the green pathway replaces natural gas with renewable electricity and water. This shift completely redefines the Front End Engineering Design (FEED) stage, moving the focus from fuel-burning furnaces to high-voltage rectifiers and hydrogen storage.
How is Green Ammonia Cost Estimated?
A Green Ammonia Plant Cost Estimation at the FEED stage is typically a “Class 3 Estimate” per AACE standards, offering an accuracy of -10% to +15%. The CAPEX is driven primarily by the electrolyzer stack (approx. 40-50% of direct costs), followed by the Haber-Bosch synthesis loop, air separation unit (ASU), and the essential hydrogen buffer storage required to manage renewable energy intermittency.
In 2026, reaching the Final Investment Decision (FID) requires more than just a list of equipment. It requires a dynamic model that accounts for the Levelized Cost of Electricity (LCOE) and the “Balance of Plant” complexities that often derail early-stage budgets.
Table of Contents
Quiz: Are You Ready for Green NH3 FID?
Complete Course on
Piping Engineering
Check Now
Key Features
- 125+ Hours Content
- 500+ Recorded Lectures
- 20+ Years Exp.
- Lifetime Access
Coverage
- Codes & Standards
- Layouts & Design
- Material Eng.
- Stress Analysis
1. CAPEX Breakdown: Electrolyzers, ASU, and the Synthesis Loop
In a traditional Ammonia project, the Steam Methane Reformer (SMR) is the heart of the capital expenditure. However, in a Green Ammonia Plant Cost Estimation, the cost structure is completely inverted. The elimination of natural gas feedstock means the SMR is replaced by a massive array of electrolyzers and power conversion systems.
Based on 2026 project benchmarks, the Total Installed Cost (TIC) for a Green Ammonia facility is generally distributed across four primary “Islands”:
Electrolyzer Island (40-50% CAPEX)
Includes the stacks (PEM or Alkaline), rectifiers, transformers, and water demineralization units. This is the most expensive component due to the high cost of noble metals in PEM stacks or the large footprint of Alkaline systems.
Ammonia Synthesis Loop (20-25% CAPEX)
The Haber-Bosch reactor, compressors, and recovery systems. While the chemistry is established, 2026 designs require “flexible” loops capable of ramping up and down based on hydrogen availability.
Air Separation Unit (10-15% CAPEX)
Extracts Nitrogen (N2) from the atmosphere. The ASU is a steady-state cryogenic process that often requires its own dedicated backup power to prevent freezing during renewable outages.
Storage & OSBL (15-20% CAPEX)
Includes Ammonia refrigeration, tankage, loading jetties, and the critical Hydrogen Buffer Storage tanks.
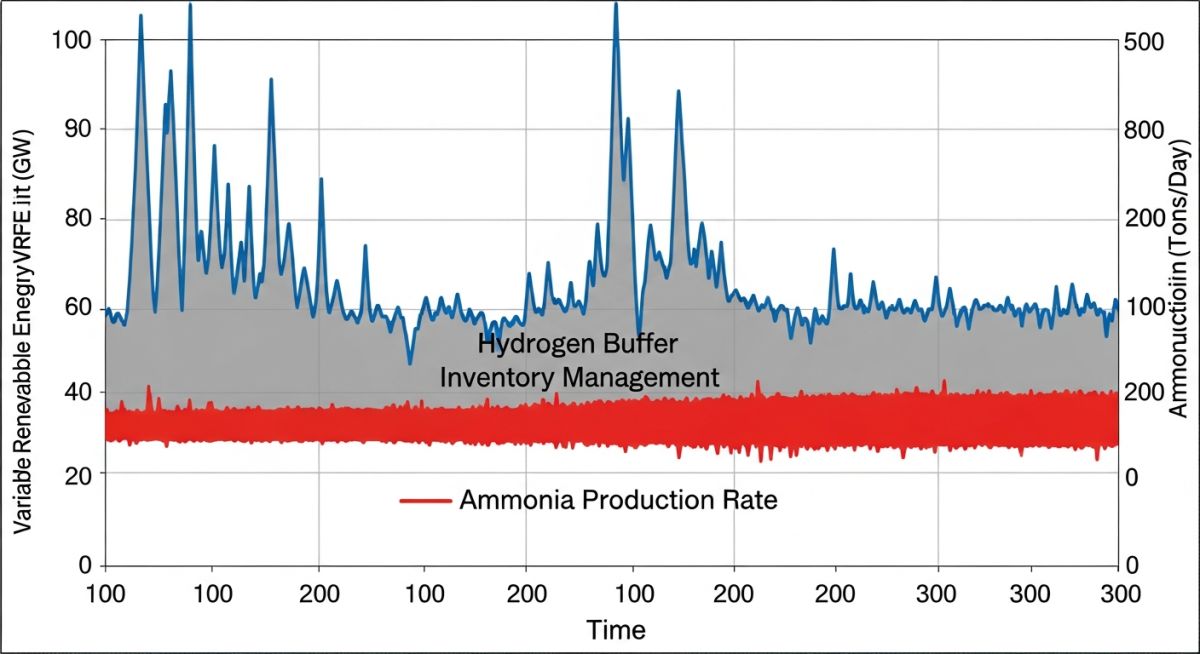
2. The “Buffer” Math: Managing Intermittency Costs
The single greatest technical challenge in a FEED for Green Ammonia Plant is the mismatch between the power source and the process. Solar and wind are intermittent (Variable Renewable Energy), while the Haber-Bosch synthesis loop prefers steady-state operation.
During the FEED phase, engineers must perform Dynamic Simulation to “right-size” the hydrogen storage. This is a critical cost-trade-off decision:
- Under-sizing the Buffer: Saves CAPEX initially but leads to frequent plant shutdowns when the wind stops. Frequent restarts damage the synthesis catalyst and increase thermal fatigue in the reactor (high OPEX).
- Over-sizing the Buffer: Ensures 24/7 operation but adds millions to the Green Ammonia Plant Cost Estimation due to the high cost of high-pressure hydrogen storage spheres or salt caverns.
Engineering Insight: The 8-Hour Rule
Most 2026 FEED packages for Green Ammonia target an 8 to 12-hour hydrogen buffer. This allows the plant to ride through short-term solar dips or wind lulls without tripping the Haber-Bosch compressor, which is the most difficult component to restart.
3. AACE Class 3 Requirements for Green Ammonia FEED
To reach the Final Investment Decision (FID), a Green Ammonia Plant Cost Estimation must graduate from a Class 4 (Factored) estimate to a Class 3 (Semi-Detailed) estimate. According to AACE International standards, this requires a project definition level of 10% to 40%.
In a green ammonia context, “definition” means more than just P&IDs. It requires a firm Electrical Single Line Diagram (SLD) because the power distribution system (transformers and rectifiers) is a major cost driver that doesn’t exist in traditional plants.
Technology Selection Matrix: Impact on CAPEX
| Parameter | Alkaline (AEL) | PEM | Solid Oxide (SOEC) |
|---|---|---|---|
| CAPEX ($/kWe) | Low ($600 – $900) | Medium ($1,100 – $1,600) | High ($2,000+) |
| Response Time | Minutes (Slow) | Seconds (Fast) | Hours (Steady State) |
| Stack Life (Hrs) | 60,000 – 90,000 | 50,000 – 80,000 | Less than 20,000 |
| Maturity | Commercial Standard | Rapid Scaling | Pilot / R&D |
Note: 2026 pricing varies by region and manufacturing volume. PEM is often preferred for wind/solar due to its fast response to power fluctuations.
4. OPEX Drivers: LCOE and The Price of Power
While CAPEX gets the project built, the Levelized Cost of Ammonia (LCOA) is dominated by OPEX—specifically the cost of renewable electricity. In a 2026 world-scale green ammonia plant, electricity accounts for 70% to 85% of the total operating cost.
// SIMPLIFIED LCOA FORMULA
LCOA = (Sum of [CAPEXt + OPEXt] / (1 + r)t) / (Sum of [Ammoniat / (1 + r)t])
Where r = Discount Rate, t = Year of Operation
During the FEED phase, the following OPEX variables must be modeled in a Sensitivity Analysis to prove project bankability:
- LCOE (Levelized Cost of Electricity): A shift of just $10/MWh in power price can swing the ammonia price by over $60/ton.
- Stack Degradation: Electrolyzer efficiency drops over time. FEED must include a “Stack Replacement Fund” in the 25-year financial model.
- Water Scarcity: Producing 1 ton of green ammonia requires roughly 1.5 tons of demineralized water. In arid regions, desalination adds significantly to the OPEX.
- Catalyst Longevity: Frequent restarts of the synthesis loop (due to power lulls) reduce the Haber-Bosch catalyst life from 10 years to as little as 3 years.
Don’t miss this video related to Green Ammonia
Summary: Master Piping Engineering with our complete 125+ hour Certification Course: ……
Green Ammonia TIC & Power Estimator
Estimate required Electrolyzer MW and Power OPEX based on target Ammonia production and LCOE.
FEED Estimation Summary
Required Electrolyzer Capacity
0.0 MW
Includes 20% margin for intermittency & BoP.
Estimated Electrolyzer Island CAPEX
$0.0 M
Stacks + Power Electronics + Water Systems.
Power Cost Per Ton NH3
$0.0 / Ton
Represents ~80% of total LCOA.
Electrolyzer Island: Procurement & Modular Strategy
Reducing Site Labor in 2026 Projects
In traditional ammonia plants, the primary cost driver was the site-fabricated SMR furnace. In a Green Ammonia Plant Cost Estimation, the focus shifts to the Electrolyzer Island. To manage the high CAPEX, 2026 FEED packages now prioritize “Modularization”—shipping pre-tested containers to the site to minimize expensive field labor.

Critical Procurement Ratios (FEED Benchmarking)
| Cost Element | Stick-Built % | Modularized % | Impact on TIC |
|---|---|---|---|
| Mechanical Installation | 100% (High) | 25% (Low) | Major field labor savings. |
| Electrical Hook-up | 100% (Complex) | 40% (Simplified) | Pre-wired rectifiers save time. |
| Project Indirects | High (Large Camp) | Low (Smaller PMT) | Reduced site accommodation cost. |
| Logistics & Shipping | Low | High | Requires specialized transport. |
Cost Tip: The Rectifier Efficiency Trap
When developing your Green Ammonia Plant Cost Estimation, don’t just focus on the stack price. In 2026, the power electronics (Rectifiers and Transformers) can cost as much as the electrolyzer stack itself. Ensure your FEED includes the “Harmonic Mitigation” costs required by the local grid operator, as these can add 5% to the Total Installed Cost (TIC).
Case Study: The Cost of Under-Sizing Hydrogen Buffer Storage
The Scenario: A developer initiated a world-scale Green Ammonia project in a high-wind coastal region. To minimize the Green Ammonia Plant Cost Estimation, the FEED team reduced the Hydrogen (H2) buffer storage from an 8-hour capacity to a 2-hour capacity, assuming the wind profiles were stable enough to keep the Haber-Bosch loop running.
The Failure: Catalyst Fatigue
During the first six months of operation, the plant experienced 14 unplanned shutdowns due to wind lulls exceeding 2 hours.
- ✖ Thermal Cycling: Frequent emergency shutdowns (ESDs) caused rapid temperature swings in the Haber-Bosch reactor.
- ✖ Catalyst Attrition: The internal catalyst beds suffered physical degradation, leading to high pressure drops and reduced NH3 yield.
Financial Impact
Production Deferment
USD 8.2 Million
Lost revenue in year one.
Catalyst Replacement
USD 3.5 Million
3 years ahead of schedule.
The Engineering Fix: Right-Sizing via Dynamic Simulation
The owners commissioned a “FEED Re-validation” study. Using 10 years of granular wind data, engineers used Dynamic Simulation to determine that a 10-hour buffer storage capacity (at 30 bar) was the “Sweet Spot” for this specific site.
The Result: The additional CAPEX for storage (USD 12M) was recouped in just 18 months through stabilized production and preserved catalyst life. This case proves that saving on “Buffer CAPEX” during FEED is a false economy.
Frequently Asked Questions (FAQ)
What is the expected LCOA for Green Ammonia in 2026?
In 2026, the Levelized Cost of Ammonia (LCOA) for world-scale green projects typically ranges between $450 and $700 per metric ton. This depends heavily on the LCOE of the connected renewable energy. Projects with power costs below $30/MWh and high capacity factors (via wind/solar hybrid) are achieving the lower end of this range, making them increasingly competitive with traditional grey ammonia.
How accurate is a Class 3 Green Ammonia Plant Cost Estimation?
A properly executed AACE Class 3 estimate at the end of FEED offers an accuracy range of -10% to +15%. For Green Ammonia, this accuracy is only possible if the electrolyzer vendor quotes are firm and the “Balance of Plant” (power electronics and water treatment) has been designed to a 30% maturity level. Class 4 estimates used in pre-feasibility are much wider (+/- 30%).
PEM vs Alkaline: Which technology results in lower CAPEX?
Alkaline (AEL) electrolyzers currently offer a lower initial CAPEX ($600 – $900/kWe) compared to PEM. However, PEM electrolyzers are often preferred in 2026 FEED packages because their fast ramp-up/down capability manages intermittent wind and solar power more effectively, which can lower the overall LCOA by reducing the need for expensive hydrogen buffer storage.
What are the critical FEED deliverables for a Green Ammonia project?
Key deliverables include the Dynamic Simulation Report (proving synthesis loop stability), Electrical Single Line Diagrams for MW-scale rectifiers, Electrolyzer Island Layouts, and the AACE Class 3 TIC Estimate. Additionally, a detailed Water Management Plan is required, as electrolysis requires high-purity demineralized water.
Conclusion: Precision in the Green Transition
Developing a Green Ammonia Plant Cost Estimation is no longer just about chemical engineering; it is about the complex marriage of power electronics and process stability. As we move into 2026, the industry has realized that the “Front End” determines the fate of the “Back End.”
By investing in a high-fidelity FEED for Green Ammonia Plant phase, owners can right-size their hydrogen buffers, choose the optimal electrolyzer technology, and secure the financing required to build the energy hubs of the future. Success is found in the balance between the volatility of nature and the stability of the synthesis loop.
📚 Recommended Resources: feed
Read these Guides


Related posts:
![High-grade industrial Wing Nut Types and Applications for mechanical assemblies.]()
Wing Nut Types and Applications: The 2026 Engineering Guide
![Industrial Monorail Crane Systems installed in a modern manufacturing plant 2026.]()
Monorail Crane Systems: Design, Types & 2026 Standards Guide
![Lead engineer performing a Factory Acceptance Test FAT on an industrial skid system 2026]()
Factory Acceptance Test FAT: The 2026 Engineering Guide to Zero-Defect Delivery
![Professional engineering workspace showing a Basis of Design document layout for a 2026 project.]()
Basis of Design: How to Write a BOD for Engineering Projects in 2026
![Industrial Flare Knockout Drum Sizing and installation in a refinery relief system.]()
Flare Knockout Drum Sizing: Design & API 521 Standards (2026 Guide)
![Advanced Reboiler Control Systems in a modern petrochemical refinery 2026.]()
Reboiler Control Systems: Engineering Guide to Precision Control 2026