Cost Estimate Classification System: The AACE 18R-97 Definitive Guide
The Cost Estimate Classification System is the financial compass for the process industries. Defined by AACE International Recommended Practice No. 18R-97, it maps the journey of a project from a vague idea (Class 5) to a rock-solid contract price (Class 1). Failing to respect these maturity levels is the #1 cause of budget overruns in EPC projects. This guide demystifies the accuracy ranges and deliverables required for each stage.
What is AACE 18R-97?
AACE 18R-97 is the global standard for the Cost Estimate Classification System in the process industries (Refining, Petrochemical, Pharmaceutical). It classifies estimates into five categories (Class 5 to Class 1) based primarily on the level of project definition (0% to 100%) rather than just the purpose of the estimate.
Quick Navigation
Test Your Knowledge: AACE Standards
Question 1 of 51. What is the primary determinant of an estimate class per AACE 18R-97?
Complete Course on
Piping Engineering
Check Now
Key Features
- 125+ Hours Content
- 500+ Recorded Lectures
- 20+ Years Exp.
- Lifetime Access
Coverage
- Codes & Standards
- Layouts & Design
- Material Eng.
- Stress Analysis
1. Theory: The 5 Levels of the Cost Estimate Classification System
The core philosophy of the AACE 18R-97 cost estimate classification is that an estimate’s quality is not determined by the software used or the time spent, but by the level of project definition (maturity) of the engineering deliverables. A highly detailed estimate based on a napkin sketch is still a Class 5 estimate.

Class 5: The “Screening” Estimate
Maturity: 0% to 2% Definition
This is used for strategic planning and feasibility studies. Engineers often ask about Class 5 cost estimate accuracy—it is notoriously wide, typically ranging from -50% to +100%. It relies heavily on stochastic methods like capacity factoring (e.g., “Cost per Barrel”) rather than itemized lists.
Class 4: The “Feasibility” Estimate
Maturity: 1% to 15% Definition
Used to select a preferred process technology or site. At this stage, major equipment lists are preliminary, and layout drawings are conceptual. The Cone of Uncertainty project management principles dictate that variance here is still too high for funding approval.
Class 3: The “Budget Authorization” Estimate
Maturity: 10% to 40% Definition
This is the critical standard for the Class 3 estimate for FID (Final Investment Decision). It forms the control budget. By this stage, P&IDs should be frozen, and detailed plot plans approved. Without reaching this maturity, sanctioning a project is financial gambling.
Class 2: Control
30-75% Maturity. Used for contractor bid analysis and establishing the baseline schedule.
Class 1: Check
65-100% Maturity. Used for check estimates on lump-sum tenders or final project change orders.
2. The Cone of Uncertainty & Calculations
The Cost Estimate Classification System is visually represented by the “Cone of Uncertainty.” As engineering progresses (moving from FEL 1 to FEL 3), the potential deviation from the final actual cost narrows effectively.

Capacity Factor Method (Six-Tenths Rule)
For Class 5 estimates where detailed data is missing, engineers use capacity scaling:
C2 = C1 × ( Q2 / Q1 )x
• C2 = Estimated Cost of New Facility
• C1 = Known Cost of Reference Facility
• x = Cost Capacity Factor (typ. 0.6)
• Q2 = Capacity of New Facility
• Q1 = Capacity of Reference Facility
Measuring Maturity: The PDRI Tool
How do you know if you are at 10% or 40% definition? Industry leaders use the Project definition rating index (PDRI). This is a weighted checklist that scores the completeness of scope documents. A low PDRI score indicates high definition (ready for Class 3), while a high score warns that the project is still in Class 4 territory.
Table 1: AACE 18R-97 Summary Matrix (2026 Edition)
| Class | Maturity Level | Primary Methodology | Typical Accuracy* |
|---|---|---|---|
| Class 5 | 0% to 2% | Capacity Factored / Parametric | -50% to +100% |
| Class 4 | 1% to 15% | Equipment Factored | -30% to +50% |
| Class 3 (FID) | 10% to 40% | Semi-Detailed Unit Costs | -20% to +30% |
| Class 2 | 30% to 75% | Detailed Unit Costs | -15% to +20% |
| Class 1 | 65% to 100% | Detailed Quantities (MTO) | -10% to +15% |
*Note: Accuracy ranges are indicative and depend on risk analysis (P50 vs P90) and project complexity.
Understanding these EPC cost estimate classes is vital for contract strategy. For example, asking a contractor for a “Fixed Price Lump Sum” when the definition is only at Class 4 (Equipment Factored) will result in a massive risk premium added to the bid price.
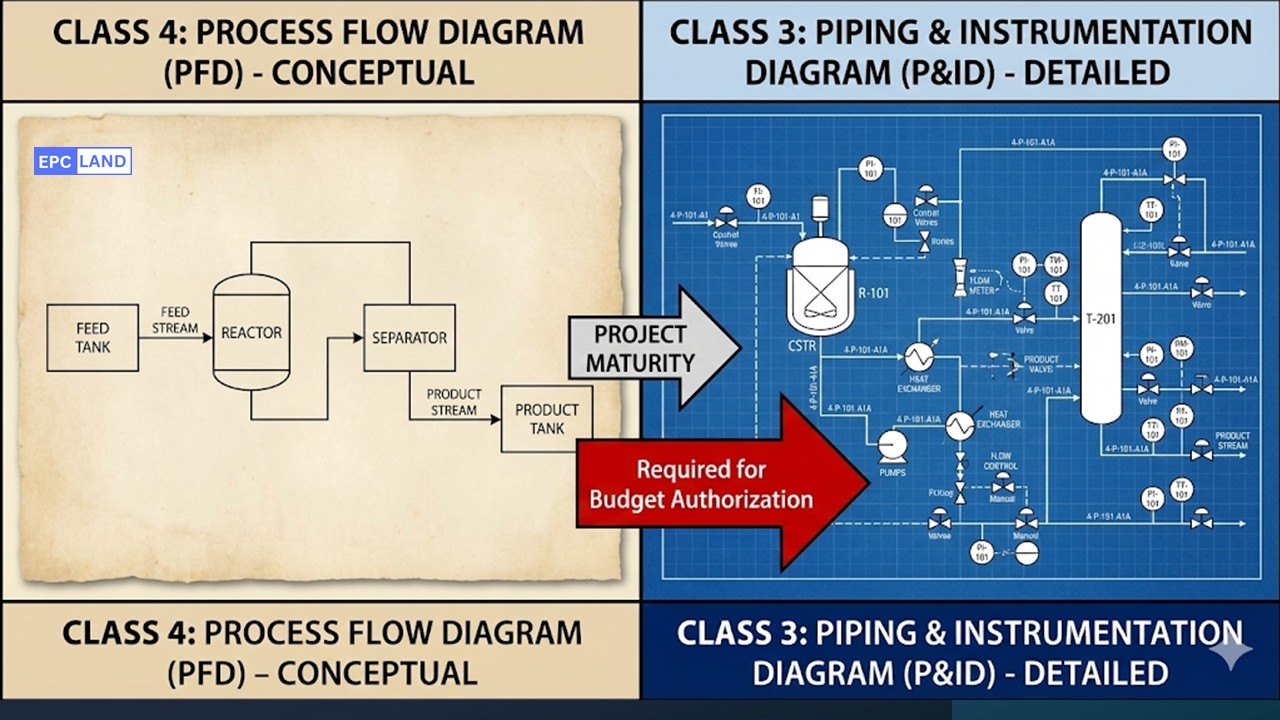
3. The Engineering Backbone: PFDs, P&IDs, and One-Lines
The AACE 18R-97 standard is specifically designed for industries heavily reliant on process flow technology—namely Chemical Manufacturing, Petrochemicals, Pharmaceuticals, and Metallurgical Plants. For these sectors, “Percent Definition” isn’t an abstract concept; it is defined by the status of three specific documents.
CLASS 4 PFDs
Process Flow Diagrams form the basis of Feasibility Estimates.
- Major equipment items (Reactors, Pumps).
- Primary process streams (Mass balance).
- Basic operating conditions (Temp/Pressure).
CLASS 3 P&IDs
Piping & Instrumentation Diagrams are mandatory for Budget Authorization.
- All piping & line numbers.
- Instrumentation & Control loops.
- Valve details & utility connections.
Electrical One-Lines
Crucial for defining the Electrical, Instrumentation & Control (EIC) scope.
- Transformers & Substations.
- Switchgear & Bus bars.
- Motor Control Centers (MCC).
Real-World Accuracy Variables
While Table 1 provides theoretical ranges, actual project performance relies on external factors. Research indicates that for complex projects, the upper accuracy range can be two to three times higher than standard if these risks are ignored:
Market Conditions: Volatility in steel/copper prices or labor shortages can break a Class 2 estimate.
Location Factors: Remote logistics, soil conditions, and local labor productivity rates.
Design Complexity: First-of-a-kind technologies carry significantly higher risk than standard units.
Estimate Range Calculator (18R-97)
Input your base cost estimate to see the High/Low accuracy bounds per Class.
Probable Final Cost Range
Select a class to see accuracy bounds.
4. The “How-To”: Estimating Methodologies by Class
To achieve the accuracy required for each AACE class, estimators must switch methodologies. You cannot achieve Class 2 accuracy using Class 5 math. Here is the breakdown of the three primary types of cost estimates used in EPC.
Stochastic / Parametric Estimating
The Logic: Uses high-level historical data curves.
Example: “A 50,000 BPD refinery unit costs $X. Therefore, a 100,000 BPD unit costs $X * (Capacity Factor).”
Factored Estimating (Lang Factors)
The Logic: Applies multipliers to the cost of major equipment.
Example: Total Equipment Cost = $1M. Total Installed Cost = $1M * 4.5 (Lang Factor for Fluids).
Deterministic / Detailed Unit Cost
The Logic: “Bottom-Up” counting of every widget.
Example: 500 meters of 4″ CS Pipe * $50/m + 200 Weld Joints * $200/weld. Requires detailed MTOs (Material Take-Offs).
Is Your Estimate Ready for FID? (Class 3 Audit)
Don’t fall victim to the “Premature FID” trap. Before sanctioning a budget, ensure your estimate passes this 5-point AACE 18R-97 checklist:
- P&IDs Frozen: Are all major process lines and instruments defined?
- Geotech Report: Do you have confirmed soil data for foundation design?
- Major Equipment Quotes: Are 50%+ of equipment costs based on vendor budget quotes (not history)?
- One-Line Diagrams: Is the main electrical distribution path defined?
- Execution Plan: Is there a preliminary construction schedule (Level 2)?
EPCLand YouTube Channel
2,500+ Videos • Daily Updates
Case Study: The Billion-Dollar Cost of Premature FID
In the world of Mega-Projects, patience pays. This case study examines a failed petrochemical expansion project in the Gulf Coast region. The project team attempted to “fast-track” the schedule by bypassing standard AACE 18R-97 cost estimate classification protocols, leading to a financial disaster that serves as a warning for the entire industry.
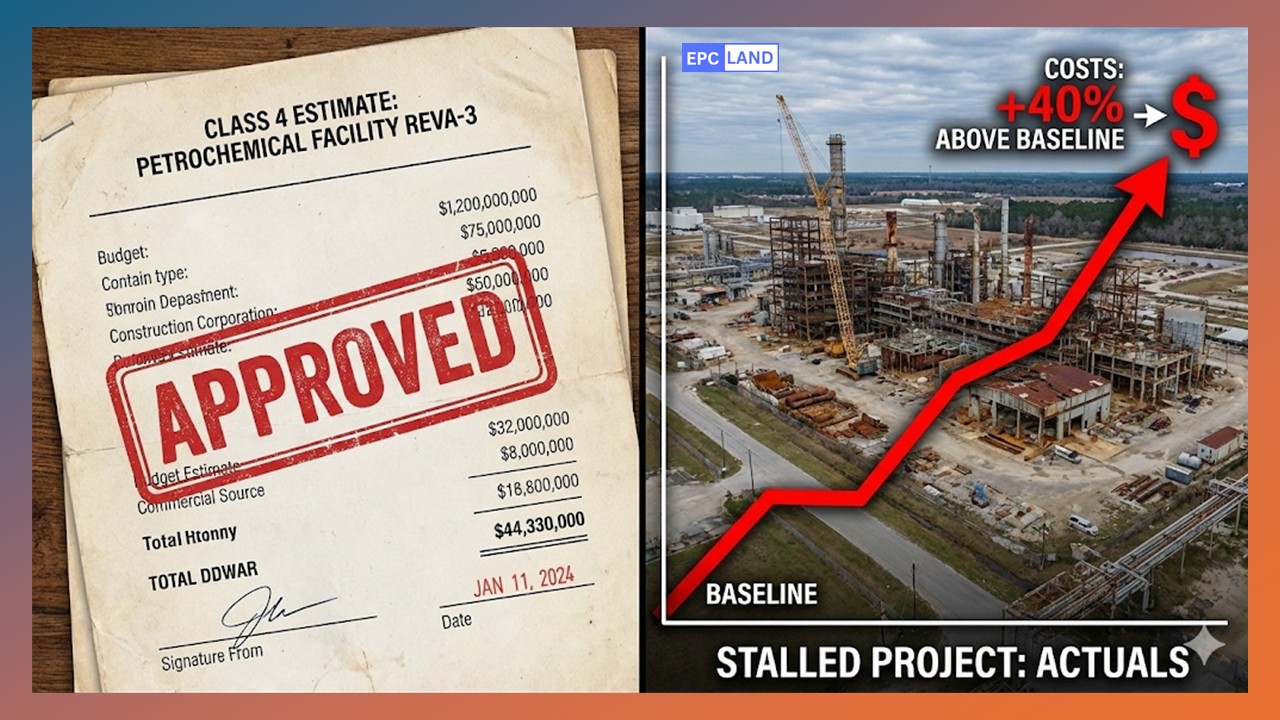
Project Scope
Polypropylene Unit Expansion
The Mistake
Sanctioned on Class 4 Data
Initial Budget (FID)
USD 450 Million
Final Actual Cost
USD 630 Million (+40%)
THE ERROR Bypassing FEL 3 Definition
To meet a market window, Executive Management pressured the Project Director to skip the full Front-End Loading (FEL 3) phase. They authorized the Final Investment Decision (FID) based on a Class 4 estimate.
The Definition Gap: At Class 4, the engineering definition was only at 5%. The estimate used “equipment factoring” methods. Crucially, the underground piping and soil conditions were not defined. The team assumed standard soil bearing capacity, but reality proved otherwise. Because they did not wait for a Class 3 estimate for FID (which requires confirmed plot plans and P&IDs), these risks were invisible in the budget.
LESSON The Corrective Action
Midway through construction, the cost overrun became undeniable. The project was halted for a “Re-Baseline.” The team was forced to perform a retroactive Project definition rating index (PDRI) audit.
- Discovery: The audit revealed that civil scope definition was scored poorly (high risk).
- Adjustment: The project had to re-estimate the remaining work using Class 2 methodologies (detailed unit take-offs) to secure supplemental funding.
- Outcome: While the facility eventually started up, the 40% cost overrun destroyed the project’s ROI (Return on Investment).
“The most expensive time to define a project is during construction. A Class 3 estimate is not just paperwork; it is the cheapest insurance policy a project owner can buy.”
Frequently Asked Questions: AACE 18R-97 Standards
What is a Class 5 cost estimate?
A Class 5 cost estimate is the least accurate estimate type defined by the AACE Cost Estimate Classification System. It is typically prepared during the “Concept Screening” phase (FEL 1) when project definition is between 0% and 2%. The expected accuracy range is very wide, often between -50% to +100%, making it suitable only for strategic planning and initial viability checks, not for budget authorization.
What is the typical Class 4 cost estimate accuracy?
Per AACE 18R-97, a Class 4 estimate (Feasibility) generally carries an accuracy range of -30% to +50%. This variance reflects the low level of engineering definition (1% to 15%). It is significantly tighter than a Class 5 but still carries too much risk for final funding. This range visualizes the “Cone of Uncertainty” concept—as definition improves, the accuracy cone narrows.
Why is a Class 3 estimate required for FID?
A Class 3 estimate for FID (Final Investment Decision) is the industry standard because it represents a “Control Budget” level of maturity (10% to 40% definition). At this stage, critical deliverables like P&IDs, Plot Plans, and Equipment Lists are frozen. This reduces the risk variance to an acceptable range (typically -20% to +30%), giving investors confidence that the project can be executed within the requested funds.
How do these classes apply to EPC Bidding?
In EPC cost estimate classes, a contractor submitting a “Lump Sum Turnkey” (LSTK) bid must typically perform a Class 2 or Class 1 estimate internally to minimize their own risk. If an owner provides only Class 4 data and asks for a fixed price, the contractor will add a massive “risk contingency” premium. Aligning the bid type (Lump Sum vs. Reimbursable) with the available estimate class is crucial for contract success.
Final Engineering Note
The Cost Estimate Classification System is more than just a table of numbers; it is a risk management framework. By strictly adhering to AACE 18R-97 and ensuring your deliverables match the required maturity level (verified via PDRI), you protect your project from the chaos of undefined scope and budget overruns.
Review Classification Matrix
Related posts:
![Varieties of Types of Structural Steel Shapes stacked at a modern engineering project site.]()
Types of Structural Steel Shapes: The 2026 Engineering Guide to AISC Sections
![Senior engineer analyzing a 3D BIM model on a tablet during EPC Digital Transformation of a refinery.]()
What is Driving EPC Digital Transformation? 2026 Engineering Guide
![High-grade industrial Aluminum Pipes and Tubes stacked in a manufacturing facility.]()
Engineering Guide to Aluminum Pipes and Tubes | 2026 Industrial Specs
![Professional metallurgical testing for Unified Numbering System (UNS) verification of alloy steel.]()
Unified Numbering System (UNS): The Ultimate Guide to Metal Identification
![Industrial steel metal grating walkway in a chemical processing plant]()
What is Metal Grating? Types, Standards, and Industrial Uses (2026)
![Senior engineer performing Instrumentation Engineering calibration on industrial pressure transmitters.]()
What is Instrumentation Engineering? Systems, Components & Examples (2026 Guide)