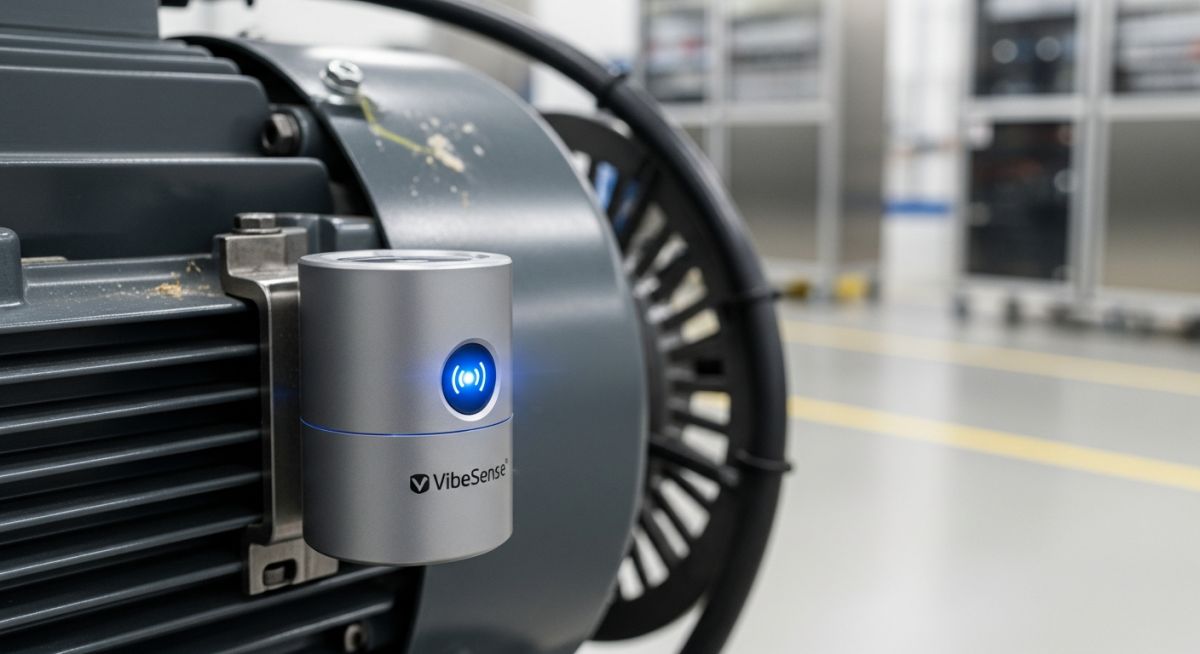
What is Vibration Monitoring and Why is it Important?
In my 20-plus years of commissioning high-pressure piping systems and heavy rotating machinery, I have seen plants brought to their knees by failures that could have been prevented. I still remember a massive boiler feed pump in a petrochemical facility that literally tore itself from its concrete plinth. The culprit? A minor shaft misalignment that escalated over three weeks. Had we installed a continuous monitoring system on that bearing housing, we would have caught the sub-synchronous vibration signature long before the shaft reached its critical limit.
This guide draws directly from my field experience to explain how dynamic oscillation tracking works, the mathematics governing sensor selection, and how to implement a world-class predictive maintenance program that keeps your plant running safely and efficiently.
Key Engineering Takeaways
- Understand the physical parameters of vibration: displacement, velocity, and acceleration.
- Learn how to map specific mechanical faults to their corresponding frequency spectrum signatures.
- Discover the critical differences between proximity probes, velocity sensors, and accelerometers.
- Master the application of international standards like ISO 20816-3 and API 670 for machine health evaluation.
Why is Vibration Monitoring Important for Plants?
Predictive Machinery Maintenance: The systematic application of vibration analysis to transition industrial facilities from reactive run-to-failure models to proactive, condition-based intervention strategies, thereby optimizing asset lifecycles under ASME and ISO frameworks.
To understand why tracking mechanical oscillations is so effective, we must look at the physics of rotating equipment. Every machine in motion generates a unique dynamic signature. When a component like a bearing, gear, or rotor begins to degrade, its physical behavior changes, causing a corresponding shift in its vibration profile. By analyzing these changes, we can pinpoint the exact root cause of the issue long before any physical signs, such as heat or noise, become apparent.
The Three Pillars of Vibration Physics
When we measure vibration, we track three primary parameters. Choosing the correct parameter is highly dependent on the operating speed of the machine:
- Displacement (mils or micrometers): This measures the actual physical distance a component moves. It is highly sensitive to low-frequency events (below 10 Hz) and is typically measured using non-contact eddy current proximity probes. It is the primary metric for monitoring fluid-film bearings in high-speed turbomachinery.
- Velocity (inches per second or millimeters per second): This represents the rate of change of displacement. Velocity is the industry standard metric for general machine health monitoring in the mid-frequency range (10 Hz to 1,000 Hz). It directly correlates with fatigue and structural stress on the machine frame.
- Acceleration (g’s or meters per second squared): This measures the rate of change of velocity. Acceleration is highly sensitive to high-frequency forces (above 1,000 Hz), making it the ideal parameter for detecting early-stage rolling element bearing defects and gear mesh anomalies.
In my early days, I saw a team try to monitor a high-frequency gear mesh frequency (around 4,500 Hz) using a velocity sensor. Because velocity amplitudes drop off rapidly at high frequencies, the sensor showed completely normal readings while the gear teeth were actively spalling. Always use accelerometers for high-frequency gear and bearing monitoring, and reserve velocity or displacement for low-to-mid range structural and rotational tracking.
The Mathematics of Vibration Conversion
For a pure sinusoidal vibration at a single frequency, the relationships between displacement (D), velocity (V), and acceleration (A) are mathematically linked by the angular frequency (omega = 2 * pi * f, where f is the frequency in Hz).
If Displacement: d(t) = D * sin(omega * t)
Then Velocity: v(t) = omega * D * cos(omega * t)
And Acceleration: a(t) = – (omega^2) * D * sin(omega * t)
In practical field terms, if you measure peak velocity (V_peak in mm/s) at a specific operating frequency (f in Hz), you can calculate the peak-to-peak displacement (D_pp in micrometers) and peak acceleration (A_peak in mm/s²) using these simplified engineering formulas:
D_pp = V_peak / (pi * f) * 1000
Formula 2: Acceleration from Velocity
A_peak = 2 * pi * f * V_peak
Formula 3: Converting Acceleration to g’s
g_amplitude = A_peak / 9806.65
These conversions are fundamental when configuring your data collectors or setting up alarm thresholds in a distributed control system (DCS) complying with API Standard 670.
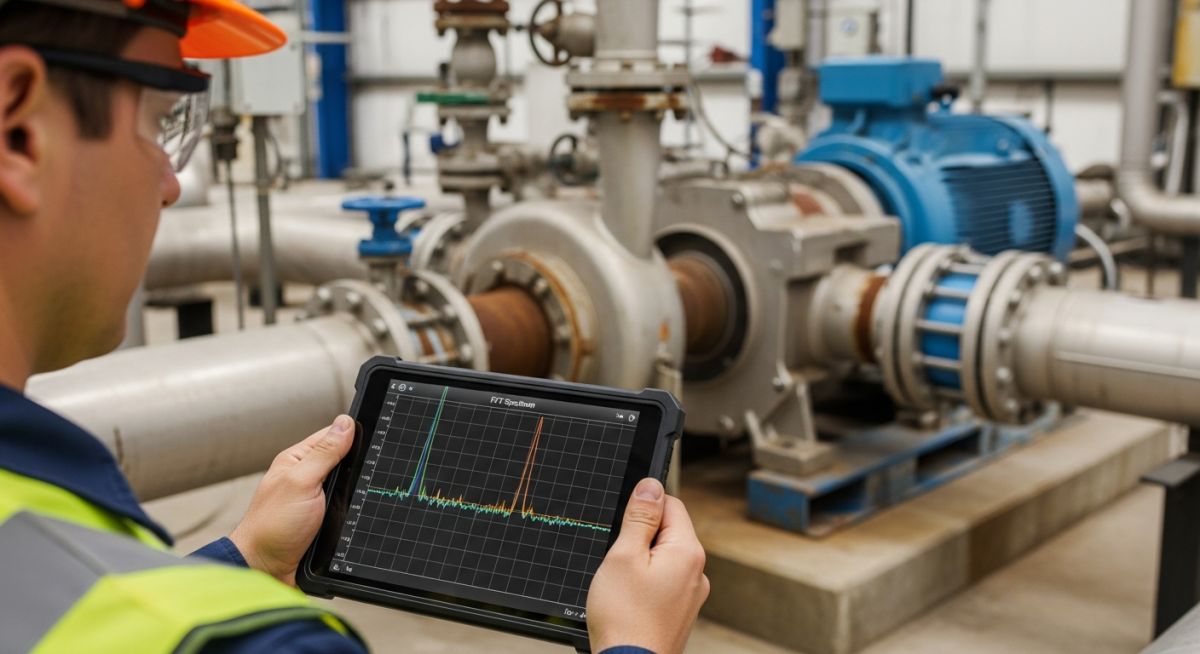
Fast Fourier Transform (FFT) Demystified
A raw vibration signal measured in the field is a complex, messy waveform representing the sum of all forces inside the machine. To make sense of it, we use the Fast Fourier Transform (FFT) algorithm. The FFT takes this time-domain signal and converts it into the frequency domain. This separates the overall vibration into individual peaks at specific frequencies, allowing us to identify exactly which component is failing.
How Does Vibration Monitoring Prevent Machine Failures?
Machinery Fault Diagnostics: The systematic identification of specific mechanical anomalies—such as unbalance, misalignment, looseness, and bearing wear—by correlating measured frequency peaks with known rotational run speeds.
By tracking the specific frequencies at which vibration peaks occur, we can diagnose machine faults with incredible accuracy. The table below outlines the standard ISO 10816-3 vibration severity zones for industrial machines, which I have used to guide maintenance decisions on hundreds of projects.
ISO 10816-3 Vibration Severity Thresholds (RMS Velocity in mm/s)
| Machine Class | Zone A (Good) | Zone B (Satisfactory) | Zone C (Unsatisfactory) | Zone D (Unacceptable) |
|---|---|---|---|---|
| Class I (Small machines < 15 kW) | < 0.71 mm/s | 0.71 to 1.80 mm/s | 1.80 to 4.50 mm/s | > 4.50 mm/s |
| Class II (Medium machines 15 kW to 75 kW) | < 1.12 mm/s | 1.12 to 2.80 mm/s | 2.80 to 7.10 mm/s | > 7.10 mm/s |
| Class III (Large rigid foundation > 75 kW) | < 1.80 mm/s | 1.80 to 4.50 mm/s | 4.50 to 11.0 mm/s | > 11.0 mm/s |
| Class IV (Large flexible foundation > 75 kW) | < 2.80 mm/s | 2.80 to 7.10 mm/s | 7.10 to 18.0 mm/s | > 18.0 mm/s |
Technical Mapping & Specifications Matrix
Selecting the right sensor technology is critical to capturing the correct physical data. The matrix below maps sensor types to their ideal applications, frequency ranges, and relevant industry standards.
| Sensor Type | Primary Parameter | Frequency Range | Common Fault Targets | Standard Reference |
|---|---|---|---|---|
| Proximity Probe (Eddy Current) | Displacement (mils/micrometers) | 0 Hz to 1,000 Hz | Shaft centerline, oil whirl, rotor unbalance | API 670 |
| Piezoelectric Accelerometer | Acceleration (g’s) | 2 Hz to 15,000 Hz | Rolling element bearing wear, gear mesh, cavitation | ISO 20816-1 |
| Velocity Transducer (Moving Coil) | Velocity (in/s or mm/s) | 10 Hz to 1,000 Hz | Structural looseness, structural resonance, piping strain | ISO 10816-3 |
How to Implement Vibration Monitoring Onsite?
Sensor Installation Protocol: The standardized field procedure for selecting, preparing, mounting, and verifying vibration sensors on industrial machinery to ensure maximum signal transmission and data integrity.
Implementing a monitoring system requires meticulous attention to detail. A poorly mounted sensor will introduce high-frequency noise or damp out critical signals, rendering your predictive maintenance program useless. Use this checklist, which I have refined over dozens of plant turnarounds, to ensure your field installations are flawless.
Field Installation & Commissioning Checklist
-
Verify Mounting Surface Flatness: Ensure the sensor mounting location is spot-faced to a surface finish of at least 63 micro-inches. Any air gaps between the sensor base and the machine housing will severely damp high-frequency signals.
-
Apply Thread-Locking Compound: Use a high-temperature, medium-strength thread locker (such as Loctite 242) on mounting studs to prevent the sensor from backing out due to continuous machine vibration.
-
Align Sensor Axis Correctly: For radial measurements, align the sensor perpendicular to the shaft centerline. For axial measurements, align it parallel to the shaft. Misalignment of the sensor axis by more than 5 degrees introduces significant measurement errors.
-
Route Cables with Strain Relief: Secure sensor cables using stainless steel conduit or heavy-duty cable ties. Leave a small service loop near the sensor to prevent cable fatigue and strain-induced signal noise.
-
Perform Loop Check and Calibration: Verify the sensor output at the junction box or DCS using a portable shaker table. Confirm that a 1g physical input matches the expected voltage or current output at the receiver.
Field Case Study: Real-World Application
The Problem: Impending Bearing Failure on a Critical Boiler Feed Pump
During a routine plant audit at a combined-cycle power plant, a 1,200 kW boiler feed pump exhibited a sudden, slight increase in audible noise. The pump was operating at 3,600 RPM (60 Hz). The plant did not have continuous online monitoring installed on this unit, relying instead on monthly manual walkdowns.
I was called in to perform an emergency vibration analysis. Using a portable analyzer with a magnetic-mount accelerometer, I captured a spectrum that showed a massive peak at 180 Hz (3X running speed) and a cluster of high-frequency peaks around 3,200 Hz with sidebands spaced exactly at 60 Hz. This signature pointed directly to severe inner-race bearing wear on the non-drive end bearing, coupled with minor shaft misalignment.
The Outcome: Planned Intervention Saves 140,000
Based on the spectral data, I recommended an immediate, planned shutdown of the pump during the upcoming weekend low-demand window. The plant team was hesitant, wanting to push the machine for another month. However, the mathematical projection of the bearing wear rate indicated that a catastrophic lockup was less than 10 days away.
During the planned weekend outage, we opened the bearing housing. The inner race of the rolling element bearing was heavily pitted, and the cage was on the verge of fracturing. We replaced the bearing and realigned the shaft to within 0.02 mm of tolerance. The total repair cost was 8,500. Had the bearing failed catastrophically during operation, it would have destroyed the pump shaft, damaged the mechanical seals, and caused an unscheduled plant outage costing upwards of 140,000.
This case highlights why periodic or continuous tracking is not just a maintenance expense—it is an insurance policy for your plant’s bottom line.
Frequently Asked Engineering Questions
What is the difference between displacement, velocity, and acceleration in vibration monitoring?
How do I choose between a proximity probe and an accelerometer?
What is an FFT and why is it used in vibration analysis?
How does sensor mounting affect the accuracy of vibration data?
What are the standard alarm limits for industrial motor vibration?
Can vibration monitoring detect electrical faults in motors?
Complete Course on
Piping Engineering
Check Now
Key Features
- 125+ Hours Content
- 500+ Recorded Lectures
- 20+ Years Exp.
- Lifetime Access
Coverage
- Codes & Standards
- Layouts & Design
- Material Eng.
- Stress Analysis