Material Selection Diagram (MSD): The Definitive Guide to Purpose, Development, and Engineering Standards
Key Takeaways
- Define the precise metallurgical boundaries to prevent localized corrosion and High-Temperature Hydrogen Attack (HTHA).
- Streamline the procurement process by standardizing Material Designations early in the FEED stage.
- Ensure full compliance with ISO 21457 and ASME standards for global EPC project execution.
What is a Material Selection Diagram?
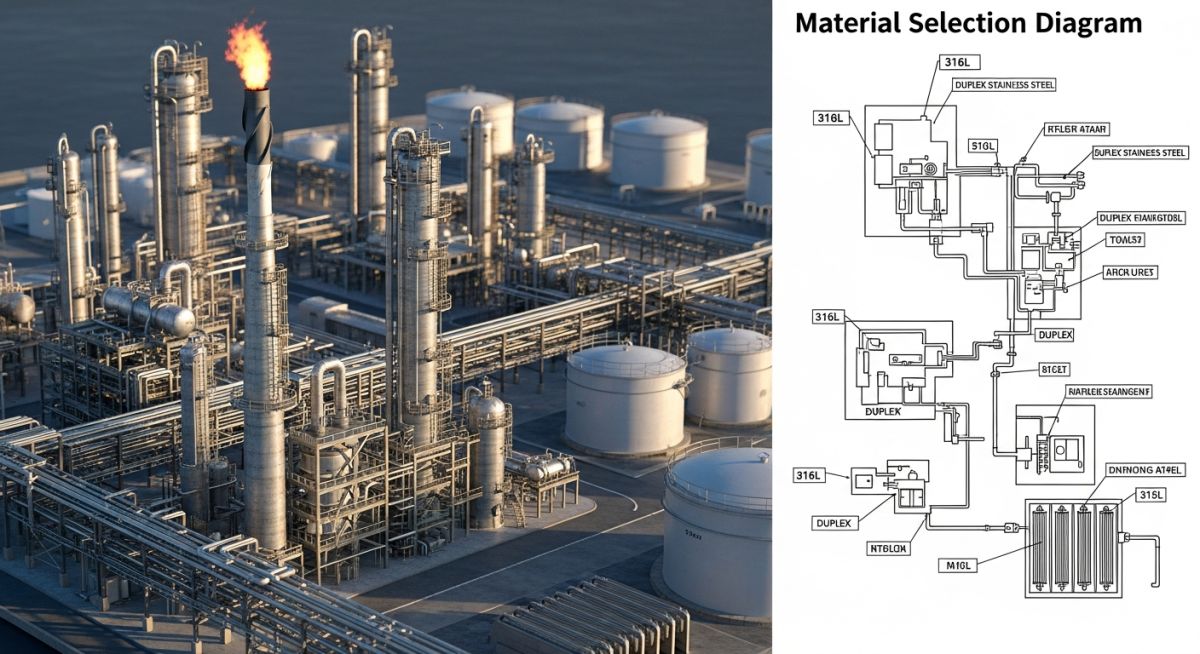
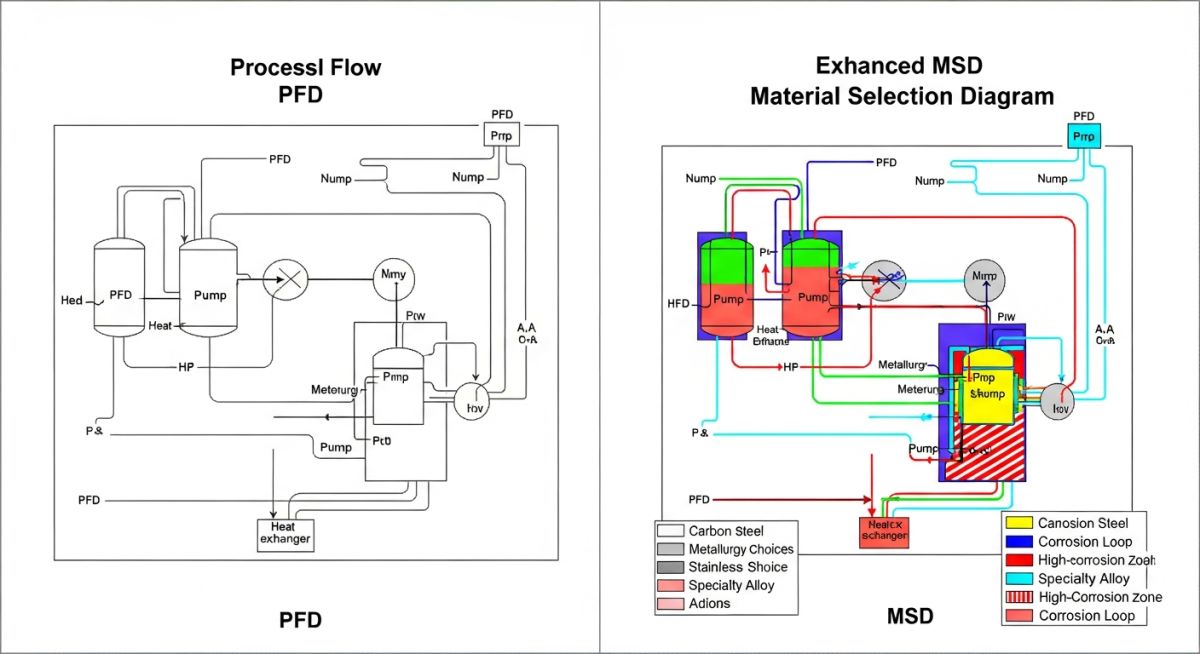
A Material Selection Diagram (MSD) is a technical engineering document that overlays metallurgical requirements, corrosion allowances, and design life data onto a Process Flow Diagram (PFD). It serves as the primary authority for selecting Materials of Construction (MOC) to ensure asset integrity under specific process conditions.
Founder’s Insight
“In my 20 years of overseeing EPC projects, I’ve seen the Material Selection Diagram evolve from a simple drawing to the single most critical ‘source of truth’ for the procurement and piping teams. If it isn’t on the MSD, it doesn’t exist in the budget.”
— Atul Singla, Founder of EPCLand
Complete Course on
Piping Engineering
Check Now
Key Features
- 125+ Hours Content
- 500+ Recorded Lectures
- 20+ Years Exp.
- Lifetime Access
Coverage
- Codes & Standards
- Layouts & Design
- Material Eng.
- Stress Analysis
MSD Proficiency Challenge
Question 1 of 5Which document serves as the primary base template for creating a Material Selection Diagram?
What is a Material Selection Diagram (MSD)?
A Material Selection Diagram (MSD) represents a critical bridge between process engineering and mechanical design. Unlike a standard Process Flow Diagram (PFD) which focuses on mass balance and fluid dynamics, the MSD is a specialized metallurgical map. It serves as the definitive authority for specifying the materials of construction for every pipe, valve, and vessel within a processing facility. By consolidating complex chemical data and corrosion mechanisms into a single visual format, the MSD ensures that every component is selected to survive its specific operating environment for the duration of its intended design life.
In modern EPC (Engineering, Procurement, and Construction) workflows, the Material Selection Diagram is not merely an optional drawing but a mandatory compliance document. It outlines the "Corrosion Loops"—areas of the plant where similar process conditions and degradation threats exist—to simplify inspection planning and material procurement. For international projects, these diagrams must align with global standards such as ISO 21457, which provides the framework for materials selection in oil and gas production systems.
Primary Purpose of the Material Selection Diagram in EPC Projects
The primary objective of a Material Selection Diagram is the mitigation of risk. By identifying potential damage mechanisms—such as Sulfide Stress Cracking (SSC), High-Temperature Hydrogen Attack (HTHA), or Chloride Stress Corrosion Cracking (CLSCC)—engineers can specify high-performance alloys or specialized coatings before the procurement phase begins. This proactive approach prevents the "material mismatch" errors that lead to catastrophic failures during commissioning or early operations.
Beyond safety, the Material Selection Diagram serves as a high-level economic optimization tool. It prevents "over-engineering" by ensuring that expensive alloys like Titanium or Inconel are only used where strictly necessary, while standard Carbon Steel (with appropriate corrosion allowance) is used for less aggressive streams. This balance is critical for maintaining project budgets while strictly adhering to asset integrity requirements.
Engineering Workflow: How to Develop a Material Selection Diagram
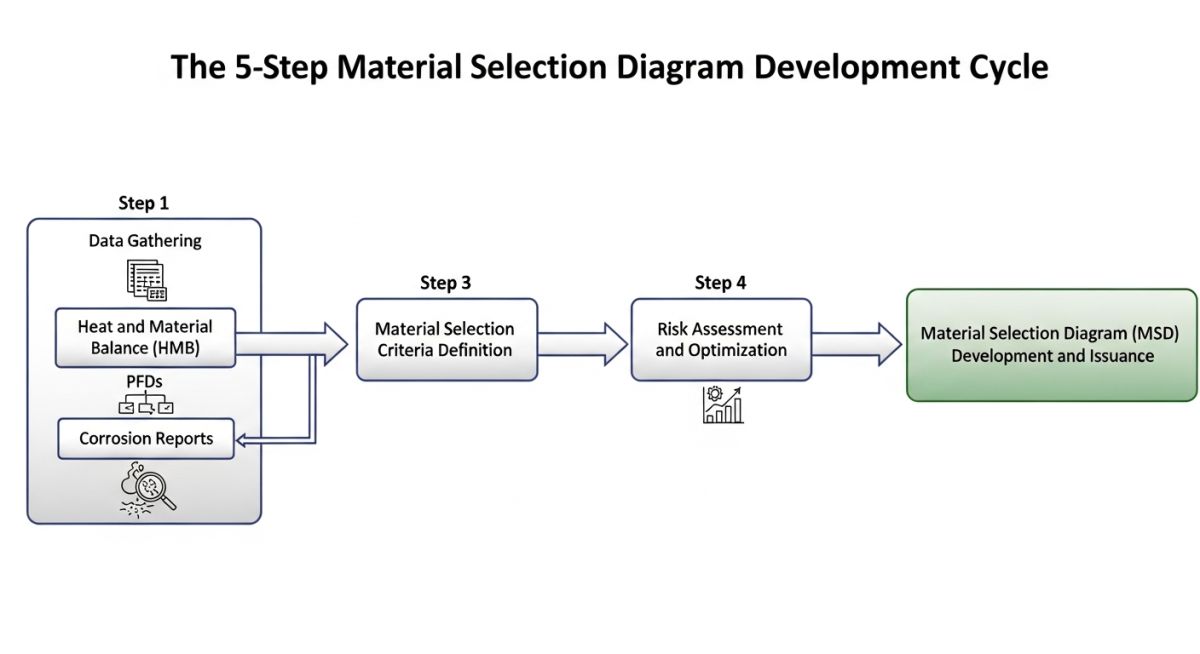
Developing a Material Selection Diagram is a multi-disciplinary effort that begins during the Front-End Engineering Design (FEED) phase. The process is iterative, typically following these key steps:
-
Step 1
PFD Overlay: Engineers start with the latest revision of the Process Flow Diagram as the base template, stripping away non-essential information to leave the main flow lines and equipment.
-
Step 2
Data Integration: Key process parameters from the Heat and Material Balance (HMB) are added, specifically focusing on temperature, pressure, and the concentrations of corrosive species like CO2, H2S, and Chlorides.
-
Step 3
Corrosion Analysis: A corrosion engineer performs a detailed study to identify degradation threats. This results in the definition of "Corrosion Loops" and the calculation of required corrosion allowances.
-
Step 4
Metallurgy Specification: Based on the analysis, specific material codes (e.g., ASTM A106, A312 TP316L) are assigned to each loop and marked clearly on the Material Selection Diagram.
Roles and Responsibilities: Who Develops the Material Selection Diagram?
While the Material Selection Diagram is a collaborative document, the Materials or Metallurgical Engineer is the primary author. They are responsible for the technical accuracy of the material choices. The Process Engineer provides the foundational stream data and PFDs, while the Corrosion Specialist provides the degradation modeling. Finally, the Piping Design team utilizes the completed MSD to generate Piping Material Specifications (PMS) and individual P&IDs, ensuring that the metallurgy specified on the diagram is physically implemented in the field.
Critical Information and Metadata to be Shown on MSD
A high-fidelity Material Selection Diagram must act as a standalone technical reference. To achieve this, it must display specific metadata that allows a piping designer or procurement officer to understand the environmental constraints without cross-referencing hundreds of pages of process reports. Every major stream should include "Material Flags" containing the partial pressures of corrosive gases, the presence of liquid water, and the anticipated pH levels.
Crucially, the Material Selection Diagram must highlight transition points. Where a high-alloy pipe connects to a carbon steel vessel, the MSD must clearly indicate the "spec break" or the exact location of the dielectric flange or dissimilar metal weld. This prevents galvanic corrosion and ensures that the more noble material is used specifically where the process chemistry demands it.
Standardized Material Designations and ASME/API Codes
Consistency in material naming is vital for global supply chains. The Material Selection Diagram typically uses Unified Numbering System (UNS) designations or standard ASME B31.3 material classes. For sour service environments, the diagram must explicitly reference NACE MR0175/ISO 15156 compliance for all wetted components.
| Service Condition | Primary Threat | Typical Material Selection | MSD Note |
|---|---|---|---|
| Low Temp (<-29°C) | Brittle Fracture | LTCS (A333 Gr. 6) | Charpy V-Notch Tested |
| Sour (H2S) Service | SSC / HIC | CS + NACE (MR0175) | Hardness <22 HRC |
| High Chloride | Pitting / SCC | Duplex (UNS S31803) | PREN >34 Required |
| High Temp Hydrogen | HTHA | Cr-Mo Steels | Ref. API RP 941 |
Determining Corrosion Allowance and Design Life Requirements
The Material Selection Diagram is the birthplace of the "Corrosion Allowance" (CA) value. While 1.5mm or 3.0mm are common industry defaults for carbon steel, the MSD calculates this based on the expected metal loss per year multiplied by the facility's design life (typically 20 or 25 years). If the calculated corrosion rate is too high (e.g., >0.3 mm/year), the MSD will dictate a shift to Corrosion Resistant Alloys (CRA) rather than simply increasing wall thickness.
Integrating Process Data into the Material Selection Diagram
Modern Material Selection Diagrams must include dynamic process data points such as partial pressures of CO2 and H2S. These are not static values; they represent the "worst-case" operating envelope, including start-up, shut-down, and upset conditions. By embedding this data directly into the MSD flags, engineers can verify that the selected metallurgy can handle transient spikes in acidity or temperature without immediate failure.
Corrosion Allowance & Design Life Calculator
Estimate the required thickness based on the Material Selection Diagram (MSD) parameters for Carbon Steel loops.
Typical range: 0.05 to 0.5 mm/yr
Case Study: Sour Gas Processing Upgrade
Project: Brownfield Debottlenecking | Location: Middle East | Year: 2026
The Engineering Challenge
An existing gas plant faced increased H2S levels (rising from 2% to 7%) due to reservoir aging. The original Material Selection Diagram specified standard Carbon Steel with a 3mm corrosion allowance. However, new simulation data indicated a severe risk of Sulfide Stress Cracking (SSC) and Hydrogen Induced Cracking (HIC) in the amine regenerator overhead.
The MSD Solution
The materials team revised the Material Selection Diagram, defining a new "Sour Loop." They mandated the use of HIC-tested Carbon Steel with mandatory post-weld heat treatment (PWHT) per NACE MR0175. Specific segments were upgraded to 316L Stainless Steel cladding where temperature exceeded 120°C.
Outcome & Impact
"By clearly defining the metallurgical boundaries on the updated Material Selection Diagram before the RFQ phase, we avoided over $1.2M in potential rework costs and ensured the 25-year asset integrity of the new piping modules."
Expert Insights: Lessons from 20 years in the field
Don't Forget the Insulation: One of the most common oversights on a Material Selection Diagram is failing to account for Corrosion Under Insulation (CUI). Always specify protective coatings on the MSD for carbon steel operating between -4°C and 175°C, even if the internal process isn't corrosive.
Dead Legs are Lethal: An MSD identifies flowing streams, but stagnant "dead legs" often experience 10x the corrosion rate. Ensure your Material Selection Diagram notes include a mandatory requirement for 3D or 5D piping rules to prevent localized failure.
Velocity Matters: High flow velocities can strip away protective magnetite layers on carbon steel. Use the Material Selection Diagram to flag high-velocity liquid lines (especially those over 3 m/s) for potential upgrade to erosion-resistant alloys.
References & Standards
The development of a Material Selection Diagram is governed by several international engineering bodies. For verified compliance, refer to the following official sources:
- ISO 21457: Petroleum, petrochemical and natural gas industries — Materials selection and corrosion control
- NACE MR0175/ISO 15156: Materials for use in H2S-containing environments in oil and gas production
- API RP 941: Steels for Hydrogen Service at Elevated Temperatures and Pressures (Nelson Curves)
- ASME B31.3: International Standard for Process Piping Metallurgy
- API RP 571: Damage Mechanisms Affecting Fixed Equipment in the Refining Industry
Frequently Asked Questions: Material Selection Diagram (MSD)
Is a Material Selection Diagram the same as a P&ID?
When should the Material Selection Diagram be finalized?
How are 'Corrosion Loops' identified on an MSD?
Why did my MSD require a change from Carbon Steel to Stainless Steel?
Can an MSD be used for field inspections?
Does the MSD include internal linings or coatings?

Related posts:
![Mastering ASME BPVC Creep Design for High Temperature Vessels]()
Mastering ASME BPVC Creep Design for High Temperature Vessels
![What is Corrosion Under Insulation and How to Prevent It]()
What is Corrosion Under Insulation and How to Prevent It
![What is ASME B31.3 Pressure Leak Test Requirements]()
What is ASME B31.3 Pressure Leak Test Requirements
![What is the Minimum Distance Between Welds in Piping?]()
What is the Minimum Distance Between Welds in Piping?
![How Buried Pipeline Stress Analysis Coating Factor Impacts Piping Integrity]()
How Buried Pipeline Stress Analysis Coating Factor Impacts Piping Integrity
![Understanding the GRE Design Envelope for Safe Piping Operations]()
Understanding the GRE Design Envelope for Safe Piping Operations