Green Hydrogen FEED Cost Estimation: A 2026 Guide to CAPEX & LCOH

Green Hydrogen FEED Cost Estimation is the critical financial modeling phase that determines whether a renewable energy project proceeds to Final Investment Decision (FID) or gets shelved. In the volatile market of 2026, accurate cost projection requires a deep understanding of evolving electrolyzer technologies and grid integration constraints.
What is Green Hydrogen FEED Cost Estimation?
Green Hydrogen FEED Cost Estimation is the systematic engineering process executed during Front-End Engineering Design to calculate the Capital Expenditure (CAPEX) and Levelized Cost of Hydrogen (LCOH) of a facility. It aims for a cost accuracy of ±10% to ±15% (AACE Class 3), accounting for the Electrolyzer Stack, Balance of Plant (BoP), water treatment, and power conditioning units, serving as the baseline for the EPC contract.
This guide breaks down the complex economics of hydrogen production, providing you with the formulas, data tables, and methodologies needed to navigate the complexities of a modern hydrogen plant.
Quick Navigation
Quiz: Test Your Hydrogen Cost Knowledge
Complete Course on
Piping Engineering
Check Now
Key Features
- 125+ Hours Content
- 500+ Recorded Lectures
- 20+ Years Exp.
- Lifetime Access
Coverage
- Codes & Standards
- Layouts & Design
- Material Eng.
- Stress Analysis
The Role of FEED in Green Hydrogen Project Viability
In the lifecycle of a renewable energy project, the Front-End Engineering Design (FEED) phase serves as the bridge between conceptual feasibility and detailed execution. For Green Hydrogen projects in 2026, the primary objective of FEED is not just technical definition, but financial certainty. Investors require a robust CAPEX estimate—typically within an accuracy of ±10% to ±15% (AACE Class 3 Estimate)—to reach a Final Investment Decision (FID).
Unlike traditional Oil & Gas projects, Green Hydrogen FEED faces unique volatility due to rapid technology maturation. A solid FEED package must deliver specific FEED Deliverables that directly impact the cost model:
- Heat & Mass Balance (HMB): Defines the exact water consumption and hydrogen production rates.
- Process Flow Diagrams (PFDs): Maps the integration of the electrolyzer with purification units.
- Equipment List with Vendor Quotes: Firm prices for long-lead items like Electrolyzer stacks and Compressors.
- Plot Plan Layouts: Defines piping lengths and cabling runs, which drive civil works and cabling costs.
- Grid Interconnection Study: Estimates the cost of substations and rectifiers needed to manage intermittent renewable power.
Without a rigorous FEED execution, “hidden” costs such as complex water demineralization or harmonic filtering often go unnoticed until the execution phase, destroying the project’s ROI.
Major Cost Drivers: Electrolyzer Stack vs. Balance of Plant (BoP)
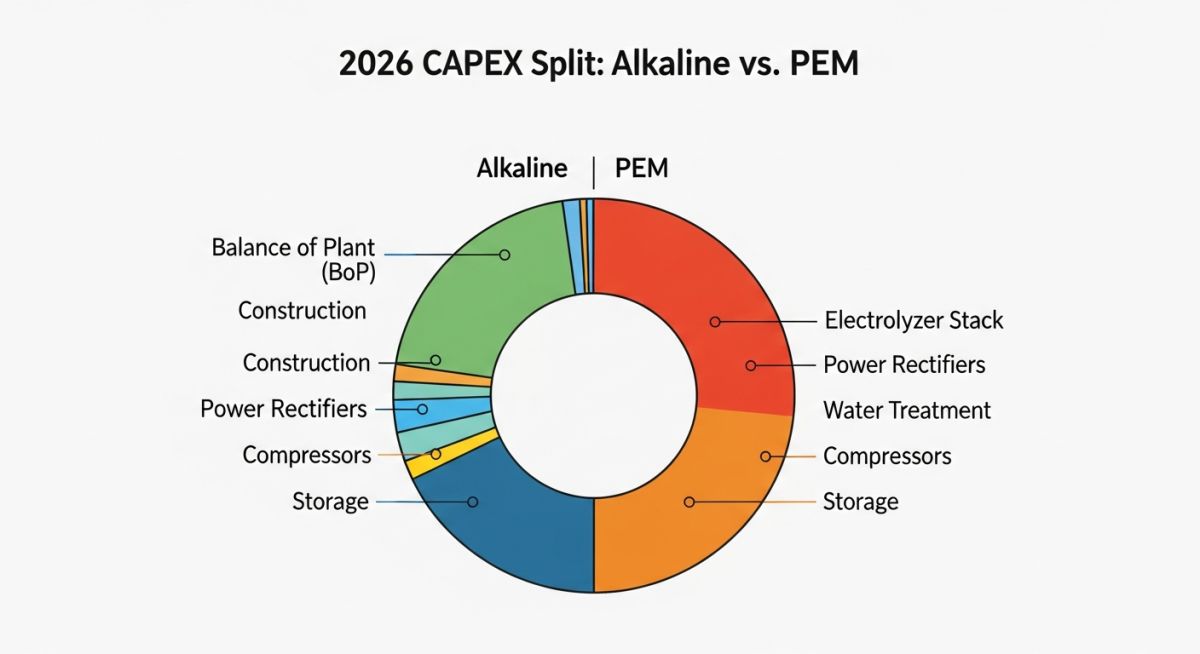
A common misconception in Green Hydrogen FEED Cost Estimation is assuming the electrolyzer stack comprises the majority of the cost. In reality, as stack manufacturing scales up in 2026, the cost burden has shifted significantly toward the Balance of Plant (BoP) Economics.
1. The Electrolyzer Stack (The Core)
The stack is the heart of the plant where water splitting occurs. In 2026, Electrolyzer CAPEX Breakdown data suggests that the stack accounts for approximately 40-50% of the total system cost for PEM technologies, but only 30-35% for Alkaline systems.
Utilizes liquid electrolyte (KOH). It is the most mature technology with the lowest CAPEX ($400-$600/kW installed). However, it has a larger physical footprint.
Uses a solid polymer electrolyte. It offers faster ramp rates for renewable coupling but entails higher costs ($700-$900/kW installed) due to precious metals like Platinum.
2. Balance of Plant (The Hidden Costs)
The BoP encompasses all auxiliary systems required to operate the stack. BoP costs often exceed 50% of the total plant cost. Key drivers include:
Electrical BoP (e-BoP)
Includes Transformers, Rectifiers (AC/DC conversion), and Switchgear. The rectifier alone can be 15-20% of the total CAPEX, especially for large-scale plants requiring stable DC current.
Mechanical BoP (m-BoP)
Includes Water Treatment Units (Deionized water is mandatory), Hydrogen Purification (De-oxo dryers), Cooling Systems, and low-pressure buffer storage tanks.
Key Engineering Insight: As project sizes scale from 10MW to 100MW, the BoP costs per MW tend to decrease (economies of scale), whereas the Stack costs scale more linearly. This non-linear scaling must be captured in your estimation model.
Methodology for Accurate CAPEX & OPEX Estimation
To achieve the ±15% accuracy required for a Class 3 estimate, relying solely on vendor quotes for major equipment is insufficient. FEED engineers must apply a factored estimation approach for bulk materials (piping, instrumentation, electrical).
The most common method used in 2026 for Front-End Engineering Design (FEED) Deliverables is the Lang Factor Method modified for electrochemical plants. However, for scaling up from pilot to commercial size, the “Power Law” equation is critical.
Capacity Scaling Formula
C2 = C1 × ( S2 / S1 )x
- C2: Cost of the new facility
- C1: Known cost of the reference facility
- S2 / S1: Ratio of capacities (e.g., 100MW / 10MW)
- x: Scaling factor (Typically 0.6 for tanks, but 0.85-0.95 for Electrolyzer Stacks due to modularity)
Critical Warning: Do not apply the standard 0.6 factor to the electrolyzer stack. Stacks do not scale geometrically; they scale modularly. A 100MW plant is essentially ten 10MW modules. Therefore, the scaling factor ‘x’ for the stack is close to 1.0, meaning you get minimal cost savings per unit on the stack itself, but significant savings on the Balance of Plant.
Calculating the Levelized Cost of Hydrogen (LCOH)
The Levelized Cost of Hydrogen (LCOH) is the break-even price at which hydrogen must be sold to cover all costs over the project’s lifetime. In 2026, renewable power input dominates this figure.
The LCOH Equation ($/kg)
LCOH = ( ∑CAPEXt + ∑OPEXt ) / ∑H2_Production
Where OPEX includes electricity costs (LCOE), water, stack replacement (every 7-10 years), and fixed O&M.
Electricity Price Sensitivity
The cost of electricity is the single largest variable, accounting for 60% to 75% of the LCOH. A shift of just $10/MWh in power price can swing the H2 cost by $0.50/kg.
Additionally, Efficiency Degradation Factors must be modeled. An electrolyzer running at 50 kWh/kg in Year 1 may degrade to 55 kWh/kg by Year 7, increasing power consumption by 10% before a stack replacement is required.
| Technology | Plant Capacity (MW) | Total CAPEX ($/kW) | System Efficiency (kWh/kg) | Stack Replacement Cycle |
|---|---|---|---|---|
| Alkaline (ALK) | 10 MW | $950 – $1,100 | 52 – 58 kWh/kg | 10 – 12 Years |
| Alkaline (ALK) | 100 MW | $600 – $750 | 51 – 56 kWh/kg | 10 – 12 Years |
| PEM | 10 MW | $1,200 – $1,400 | 55 – 62 kWh/kg | 7 – 9 Years |
| PEM | 100 MW | $850 – $1,000 | 54 – 60 kWh/kg | 7 – 9 Years |
2026 LCOH Estimator: Green Hydrogen
Estimate the Levelized Cost of Hydrogen ($/kg) based on AACE Class 3 parameters.
Includes Stack + BoP + Civil + Install
Estimated LCOH
Cost Component Split (Est.)
Don’t miss this video related to Green Hydrogen
Summary: Welcome to EPCLAND! This is your definitive starting guide to India’s ambitious Green Hydrogen ecosystem. In Module 1, we ……
The Impact of Subsidies: IRA 45V vs. EU Hydrogen Bank
In 2026, a FEED Cost Estimate is incomplete without a Techno-Economic Analysis (TEA) of available subsidies. While the “Naked LCOH” (pure CAPEX + OPEX) often hovers around $5.00 – $7.00/kg, government incentives in the US and Europe can artificially suppress this cost to compete with Grey Hydrogen ($1.50/kg).
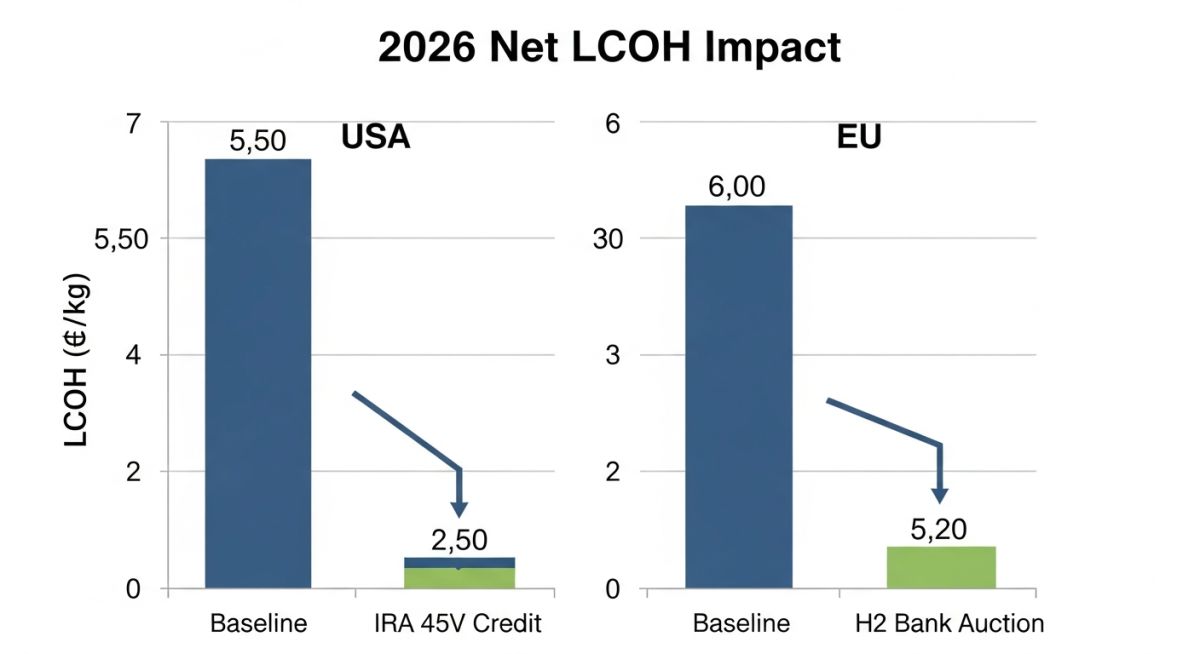
🇺🇸 USA: The IRA (Section 45V)
The Inflation Reduction Act offers a Production Tax Credit (PTC) of up to $3.00/kg for 10 years. This is a “fixed” benefit, meaning if your production cost is $4.50, your effective cost becomes $1.50.
- Additionality: New renewable power only.
- Hourly Matching: H2 production must match RE generation hour-by-hour.
- Geographic Correlation: Power must be sourced from the same grid region.
🇪🇺 EU: The Hydrogen Bank
The EU mechanism is an Auction System (Fixed Premium). Projects bid for a subsidy per kg. Recent 2025 auctions cleared between €0.38 and €0.48/kg.
| Region | Mechanism | Max Value (2026) | Impact on FEED Design |
|---|---|---|---|
| USA | Tax Credit (45V) | $3.00 / kg | Requires complex metering & software for hourly matching (RECs). |
| Europe | Competitive Auction | ~ €0.50 / kg | Forces aggressive CAPEX reduction to win bids. |
| Australia | Hydrogen Headstart | $2.00 / kg (AUD) | Focus on large-scale export logistics (Ammonia conversion). |
*Note: Subsidies are subject to change based on 2026 policy updates. Values shown are estimates for commercial FID planning.
Safety & Risk Budgeting: The Cost of Compliance (HSE)
Green Hydrogen is classified as a Group IIC gas (the most ignitable category). Consequently, safety is not just an engineering constraint; it is a massive budgetary line item. In a 2026 Class 3 Estimate, “Safety & Compliance” can account for 12-18% of the Total Installed Cost (TIC).

1. Soft Costs: Engineering Studies
During FEED, you cannot rely on generic layouts. You must budget for rigorous, man-hour-intensive safety workshops. If these are skipped, the EPC phase will face expensive rework.
- HAZOP: Hazard & Operability Study. Typically $40k – $60k per 50MW unit.
- LOPA / SIL: Layer of Protection Analysis. Defines if you need SIL 2 or SIL 3 instrument loops.
- QRA: Quantitative Risk Assessment. Required for environmental permitting.
2. Hard Costs: Ex-Rated Equipment
Standard industrial equipment cannot be used in Hydrogen processing areas. You must procure ATEX / IECEx certified components.
The “Ex” Premium
A standard pressure transmitter might cost $800. An Ex-d (Flameproof) IIC Hydrogen-rated transmitter costs $2,200.
Ventilation cost: To de-classify a room from Zone 1 to Zone 2, you need high-changeover HVAC systems, adding significant electrical load and ducting costs.
The “Safety Premium” on Common Items (2026 Prices)
| Item Description | Standard Cost (Safe Area) | Ex-Rated Cost (Zone 1 IIC) | Multiplier |
|---|---|---|---|
| LED Lighting Fixture | $150 | $450 – $600 | 3.0x – 4.0x |
| Electric Motor (50kW) | $3,500 | $6,500 | 1.8x |
| Junction Box (SS316) | $200 | $850 | 4.2x |
| H2 Leak Detector | N/A | $1,800 | New Line Item |
📚 Recommended Resources: Feed
Read these Guides


Frequently Asked Questions (FAQ)
What is the estimated Green Hydrogen plant cost per MW in 2026?
In 2026, the Total Installed Cost (TIC) for a commercial-scale Green Hydrogen plant typically ranges between $600 and $1,100 per kW. Large-scale Alkaline projects (100MW+) are seeing costs dip below $700/kW, while PEM systems generally command a premium ($850-$1,000/kW) due to higher material costs (Iridium/Platinum), though the gap is narrowing compared to 2024 benchmarks.
How does renewable intermittency impact FEED cost estimation?
Intermittency is a major “hidden” cost driver. A variable power supply (Solar/Wind) requires significantly larger Balance of Plant (BoP) investments. This includes larger buffer storage tanks, oversized compressors (to handle peak vs. average flow), and battery energy storage systems (BESS) to smooth out rectifiers. Failing to model this dynamic behavior during FEED can lead to CAPEX overruns of 20-30%.
What is the typical OPEX for a Green Hydrogen facility?
Operational Expenditure (OPEX) is dominated by electricity costs, which account for 60-75% of the Levelized Cost of Hydrogen (LCOH). Fixed O&M (Maintenance, Labor, Insurance) typically costs 2-4% of the initial CAPEX per year. Additionally, stack replacement costs (every 7-10 years) must be factored into the lifecycle cost model.
What is the difference between Class 3, Class 4, and Class 5 estimates?
Class 5 is a conceptual estimate (Accuracy: -50%/+100%) used for screening. Class 4 is a Pre-FEED feasibility study (Accuracy: -30%/+50%). Class 3 is the standard for FEED completion and FID (Accuracy: -10%/+15%). Moving from Class 4 to Class 3 requires firm vendor quotes for the Electrolyzer and Compressors, along with defined P&IDs.
Mastering the Economics of Hydrogen
Cost Estimation in 2026 is no longer about guessing the price of a stack; it is about rigorous system integration. The winners in the EPC space will be those who accurately model the Balance of Plant and optimize the LCOH through smart engineering, not just cheap procurement.
Epcland Engineering Team • Updated January 2026

Related posts:
![Comparison of raw PTFE material and an industrial PTFE-lined steel pipe flange]()
Teflon vs PTFE: Major Differences in Industrial Piping Applications
![Severe metal galling damage on a stainless steel threaded bolt and nut.]()
What is Metal Galling and How to Prevent It
![Certified welder performing structural welding repair on a heavy steel beam with sparks flying.]()
Mastering Industrial Welding Repair Procedures for Structural Integrity
![A fully assembled industrial pump skid system with stainless steel piping and control panels in a factory.]()
What is an Industrial Pump Skid and Its Key Advantages?
![Side-by-side comparison of an industrial flow meter and a digital flow transmitter installed on a pipeline.]()
Flow Transmitter vs Flow Meter: Key Differences Explained
![Wireless vibration sensor mounted on an industrial electric motor for condition monitoring.]()
What is Vibration Monitoring and Why is it Important?