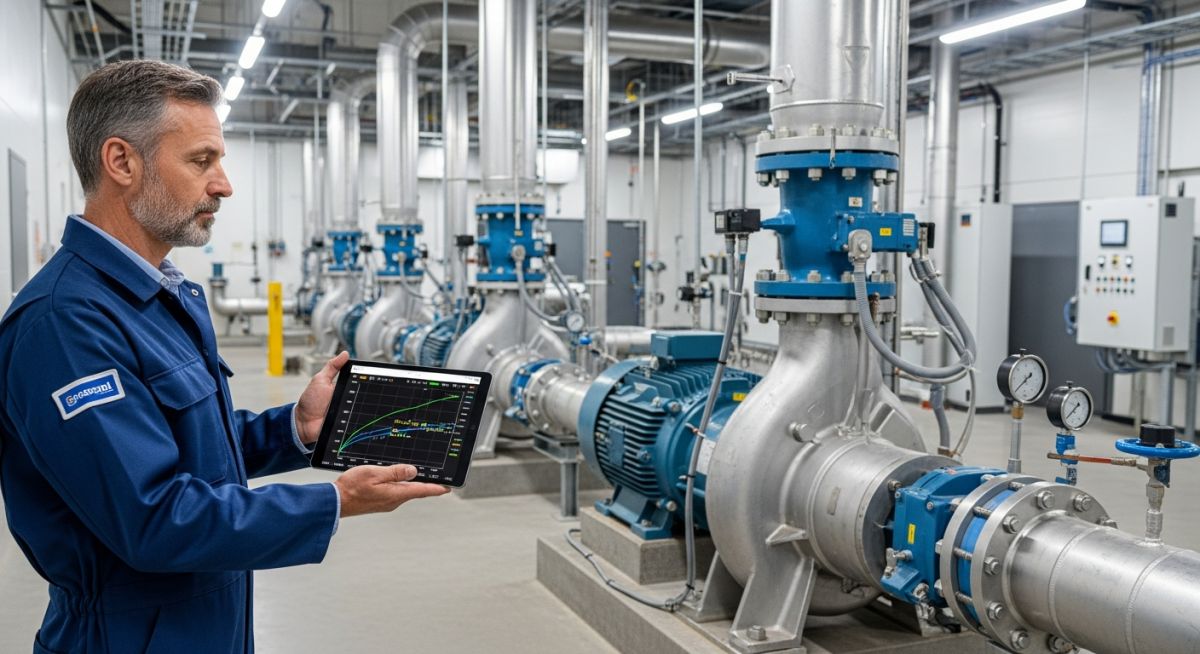
Master the Pump Performance Curve. Learn about Head, Power, Efficiency, and NPSHr curves to optimize pump selection and prevent cavitation.
Master the Pump Performance Curve. Learn about Head, Power, Efficiency, and NPSHr curves to optimize pump selection and prevent cavitation.
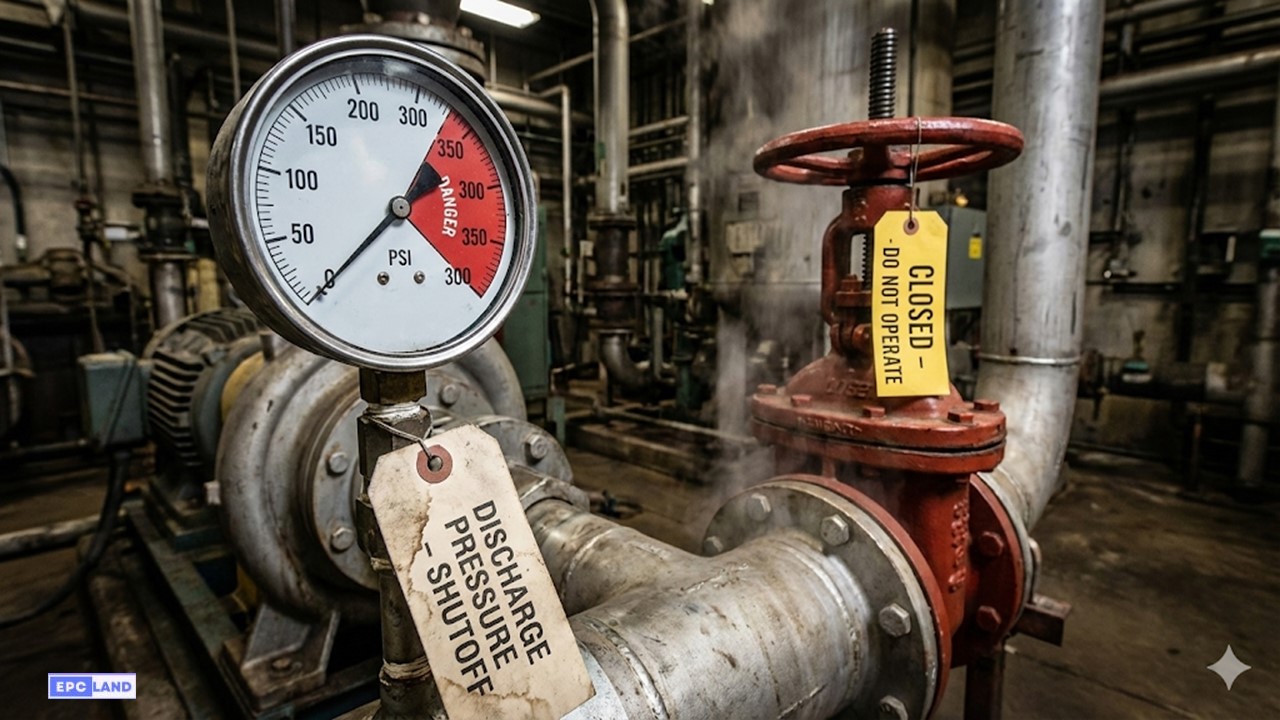
Master Pump Shutoff Pressure calculation. We explain the Shutoff Head Formula, how to read the Pump Performance Curve, and the dangers of Dead Heading.