FEED Cost Estimation in Oil & Gas: A 2026 Guide to AACE Class 3

Figure 1: Developing a Total Installed Cost (TIC) estimate requires integrating engineering data with current market pricing.
The success of any major energy project hinges on the accuracy of the FEED Cost Estimation in Oil & Gas. After months of engineering and design, the Front End Engineering Design (FEED) phase culminates in one critical number: the Capital Expenditure (CAPEX) budget. This number determines whether the project reaches the Final Investment Decision (FID) or is shelved indefinitely.
What is a FEED Cost Estimate?
A FEED Cost Estimate is typically defined as an AACE Class 3 Estimate. It is a semi-detailed unit cost estimate used to form the basis for the budget authorization (Final Investment Decision).
- Purpose: Budget Authorization & Control.
- Methodology: Semi-Detailed Unit Costs with Line-Item MTOs.
- Expected Accuracy: Typically -10% to +20% (depending on complexity).
- Engineering Maturity: Requires 10% to 40% definition of the project scope.
Unlike the broad “Capacity Factored” estimates used in the feasibility stage, the FEED estimate is built from the bottom up. It relies on firm piping material take-offs (MTOs), equipment quotes, and location-specific labor productivity factors.
Table of Contents
Quiz: Are you ready for FID?
Complete Course on
Piping Engineering
Check Now
Key Features
- 125+ Hours Content
- 500+ Recorded Lectures
- 20+ Years Exp.
- Lifetime Access
Coverage
- Codes & Standards
- Layouts & Design
- Material Eng.
- Stress Analysis
1. What is an AACE Class 3 Estimate?
In the Oil & Gas industry, cost estimates are not random guesses; they are governed by strict standards set by AACE International (formerly the Association for the Advancement of Cost Engineering). The specific standard relevant to FEED is Recommended Practice No. 18R-97.
A Class 3 Estimate is the expected output of the FEED phase. It serves as the “Budget Authorization Estimate” used to secure the Final Investment Decision (FID). Unlike earlier estimates based on capacity factors, Class 3 is based on semi-detailed engineering data.

Class 3 Specifications (Summary)
- Project Definition: 10% to 40% complete.
- Purpose: Budget Authorization / Control.
- Methodology: Semi-Detailed Unit Costs with Line Items.
- Expected Accuracy: Low side (-10% to -20%), High side (+10% to +30%).
- Preparation Effort: 0.2% to 1.0% of TIC.
2. Structure of CAPEX: Direct vs. Indirect Costs
To build a robust estimate, the Total Installed Cost (TIC) is broken down into specific buckets. Understanding the difference between Direct and Indirect costs is crucial for benchmarking and cost control.
🏗️ Direct Costs
Costs associated with the permanent facilities that will remain after construction.
- Equipment: Vessels, Pumps, Compressors (based on vendor quotes).
- Bulk Materials: Piping, Structural Steel, Concrete, Cable Trays (based on MTOs).
- Direct Labor: The wages of welders, fitters, and electricians installing the materials.
- Subcontracts: Painting, Insulation, and NDE services.
📋 Indirect Costs
Costs required to support the construction but do not become part of the final facility.
- Field Indirects: Temporary site offices, scaffolding, cranes, camp facilities.
- Home Office Costs: Detailed Engineering hours, Procurement services, Project Management.
- Freight & Logistics: Shipping equipment to site.
- Commissioning & Start-up: Spare parts and vendor assistance.
The Critical Boundary: ISBL vs. OSBL
Cost Engineers strictly separate the project into two zones:
- ISBL (Inside Battery Limits): The core process units (e.g., the Crude Distillation Unit). This is where the highest cost density exists (Exotic alloys, high-pressure vessels).
- OSBL (Outside Battery Limits): The supporting infrastructure: Tank farms, Utility generation (Power/Water), Flare systems, and Interconnecting Piperacks.
3. Estimation Methodologies: From Factors to MTOs
The transition from a Feasibility Study (FEL 2) to FEED (FEL 3) marks a shift in methodology. You move from Stochastic (Factored) methods to Deterministic (Unit Rate) methods.
| Cost Element | Class 4 Method (Pre-FEED) | Class 3 Method (FEED / FID) |
|---|---|---|
| Major Equipment | Historical Equipment Charts / Capacity Scaling (Exponent 0.6) | Firm Budget Quotes from Vendors |
| Piping & Valves | Percentage Factor of Equipment Cost (e.g., Lang Factor) | Detailed MTO (Line-by-Line for Large Bore) |
| Civil & Structural | % Factor based on Plant Area | Volume Calculation (m3 Concrete, Tons Steel) from Plot Plan |
| Electrical / Inst | Factored per I/O count or Motor kW | Preliminary Cable Schedule & Instrument List |
The “Piping Dominance” Rule
In a typical petrochemical plant, Piping (Materials + Labor) accounts for roughly 30% to 40% of the Direct Field Cost. Therefore, the accuracy of the Piping Material Take-Off (MTO) is the single biggest driver of FEED estimate reliability. Small Bore Piping (under 2″) is usually still factored (e.g., 10-15% of Large Bore cost) as it is not fully modeled in FEED.
4. Calculating Contingency & Escalation
A raw estimate without risk provisions is a guarantee of failure. In 2026, dealing with volatile markets requires rigorous calculation of two distinct adders: Contingency and Escalation.
Contingency (Risk)
Funds to cover “known unknowns”—errors, omissions, and minor scope changes that are expected but undefined.
- Method: Monte Carlo Simulation (Range Analysis).
- Typical FEED Value: 10% to 15% of TIC.
- Note: It is NOT for major scope changes (like adding a new unit).
Escalation (Inflation)
Funds to cover price increases over time due to market conditions (steel prices, labor rates).
- Method: Expenditure Profile x Annual Inflation Rate.
- Typical 2026 Rate: 3% to 5% per annum.
- Note: Calculated from the Estimate Date to the midpoint of construction.
The Total Installed Cost (TIC) Formula
// BASIC TIC AGGREGATION
TIC = (Direct Costs + Indirect Costs) × (1 + Contingency%) + Escalation
// ESCALATION LOGIC (Simplified)
Escalation = Base Cost × [(1 + i)n – 1]
i = Annual Inflation Rate (e.g., 0.04 for 4%)
n = Years to Midpoint of Expenditure
Don’t miss this video related to FEED Cost Estimation in Oil & Gas

Summary: Master Piping Engineering with our complete 125+ hour Certification Course: ……
TIC Estimator & Validation Tool
Estimate Total Installed Cost (TIC) based on Major Equipment cost using Lang Factors + AACE Contingency logic.
Selects the multiplier for Piping, Civil, Electrical, and Indirects.
Total Estimated TIC
$56.88 M
Class 3 Range: $51.19 M to $68.26 M
Validating the Estimate: Benchmarking & KPIs
The “Cold Eye Review” Process
Before presenting the number to the Board for FID, the estimate must undergo a Validation Cycle. This typically involves a “Cold Eye Review” by an independent party (like IPA or an external consultancy) to check if the costs align with historical norms.
Standard Validation Ratios (2026 Norms)
| Metric / Ratio | Typical Range | Validation Logic |
|---|---|---|
| Engineering % of TIC | 10% – 18% | If < 8%, the design budget is likely underestimated. If > 20%, the project may be “gold-plated.” |
| Indirects % of Directs | 35% – 45% | Includes temporary facilities and CM. A ratio below 30% usually signals missing support costs (e.g., scaffolding/cranes). |
| Bulk Material Factor | 60% – 80% | Bulks (Pipe, Steel, Cable) as a percentage of Major Equipment cost. Used to check MTO completeness. |
| Contingency % | 10% – 15% | For a Class 3 estimate, anything below 10% is aggressive; anything above 20% suggests poor scope definition. |
Check 1: Quantity Audits
Do the specific quantities make sense? E.g., Tons of Steel per $1M CAPEX or Cubic Meters of Concrete per Equipment Item. These physical ratios are harder to manipulate than dollar values.
Check 2: Productivity Verification
Is the assumed Manhours per Ton for steel erection achievable in the specific location? (e.g., US Gulf Coast vs. Middle East vs. Southeast Asia norms vary by factor of 2.0).
Case Study: The “Brownfield Factor” Error
The Scenario: A mid-sized refinery planned a Diesel Hydrotreater revamp. The FEED cost estimate was developed using standard industry “Greenfield” labor norms (1.0 Productivity Factor). The project team assumed that because the unit was small, construction would be fast.
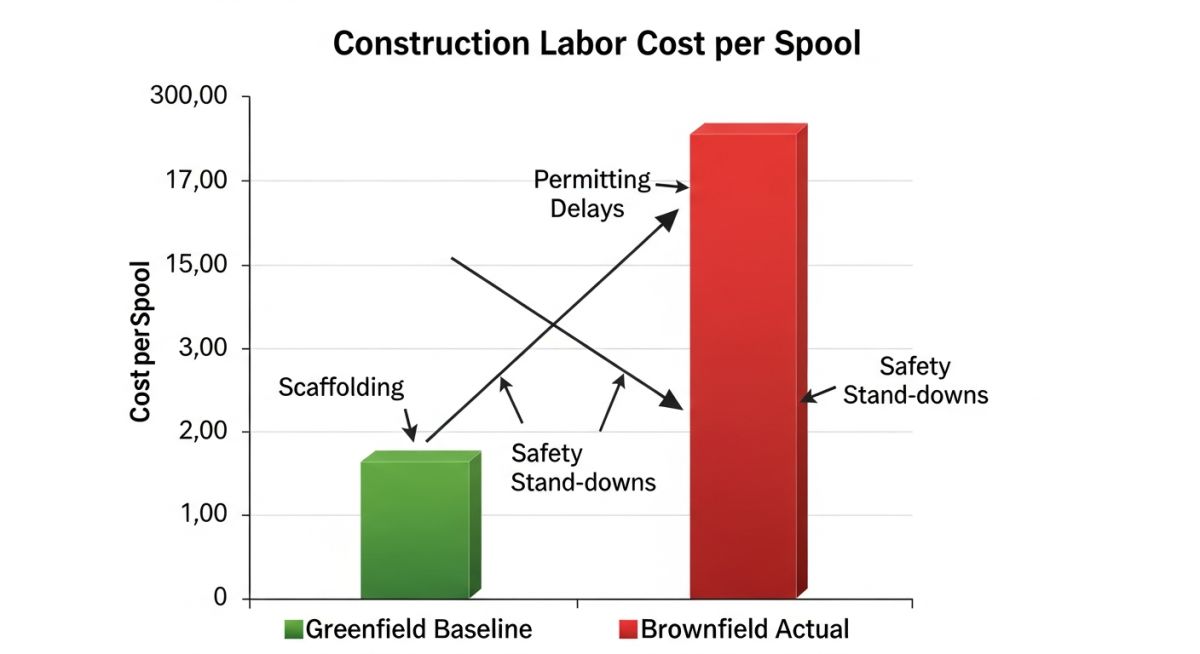
The Estimation Error
The estimator used standard “Page & Nation” man-hours for piping installation. They failed to account for the live plant environment.
- ✖ Hot Work Permits: Crews lost 1.5 hours every morning waiting for gas testing and permits.
- ✖ Scaffolding Density: Existing racks were so congested that scaffolding costs were 300% of the norm.
- ✖ Fire Watch: Every welder required a dedicated fire watch, doubling the manpower count.
Financial Consequences
Piping Labor Budget
$12.0 Million
Actual Cost at Completion
$21.5 Million
Productivity Factor: 1.8 (vs 1.0 planned)
Total Overrun
+$9.5 Million
Lesson: Apply Brownfield Multipliers
In 2026, accurate FEED estimates for revamps MUST apply a Brownfield Multiplier (typically 1.35 to 1.60) to base labor hours. Furthermore, “Time-on-Tools” studies should be conducted during FEED site surveys to validate permit issuance times.
Frequently Asked Questions (FAQ)
What is the difference between a Cost Estimate and a Budget?
A Cost Estimate is a technical prediction of probable costs based on scope and data at a specific point in time (e.g., AACE Class 3). A Budget is the allocated funding set by management, which typically equals the Estimate plus Management Reserve. The Estimate is the “Engineering Reality,” while the Budget is the “Financial Limit.”
Does the FEED Estimate (TIC) include “Owner’s Costs”?
Usually, yes, but it must be explicitly defined. A true Total Installed Cost (TIC) should include EPC Contractor costs (Directs + Indirects) plus Owner’s Costs (Land acquisition, Owner’s PMT, Permits, First Fill Catalysts). Excluding Owner’s Costs is a common reason for apparent budget overruns later.
What is the “Lang Factor” mentioned in cost engineering?
The Lang Factor is a parametric estimating tool developed by Hans Lang. It multiplies the total cost of major equipment by a factor (typically 3.0 to 5.0) to estimate the total plant cost. While useful for Class 4/5 estimates or sanity checks, it is not accurate enough for a definitive Class 3 FEED estimate.
How do I account for currency fluctuation in international projects?
Currency risk is handled via a specific “Currency Contingency” or hedging strategy. The base estimate is usually developed in a single master currency (e.g., USD) using fixed exchange rates set at the start of FEED. Any variance during execution is tracked against the currency reserve, not the engineering contingency.
Conclusion: Precision Secures Investment
FEED Cost Estimation in Oil & Gas is the bridge between engineering vision and financial reality. In 2026, where market volatility is the norm, relying on outdated factors or “rule of thumb” estimates is a recipe for disaster.
To secure a Final Investment Decision (FID) that stands the test of time, Project Managers must insist on an AACE Class 3 standard—built on firm Equipment Quotes, detailed Piping MTOs, and realistic Brownfield Labor factors. Remember: It is better to be roughly right than precisely wrong.

Related posts:
![High-grade industrial Wing Nut Types and Applications for mechanical assemblies.]()
Wing Nut Types and Applications: The 2026 Engineering Guide
![Industrial Monorail Crane Systems installed in a modern manufacturing plant 2026.]()
Monorail Crane Systems: Design, Types & 2026 Standards Guide
![Lead engineer performing a Factory Acceptance Test FAT on an industrial skid system 2026]()
Factory Acceptance Test FAT: The 2026 Engineering Guide to Zero-Defect Delivery
![Professional engineering workspace showing a Basis of Design document layout for a 2026 project.]()
Basis of Design: How to Write a BOD for Engineering Projects in 2026
![Industrial Flare Knockout Drum Sizing and installation in a refinery relief system.]()
Flare Knockout Drum Sizing: Design & API 521 Standards (2026 Guide)
![Advanced Reboiler Control Systems in a modern petrochemical refinery 2026.]()
Reboiler Control Systems: Engineering Guide to Precision Control 2026